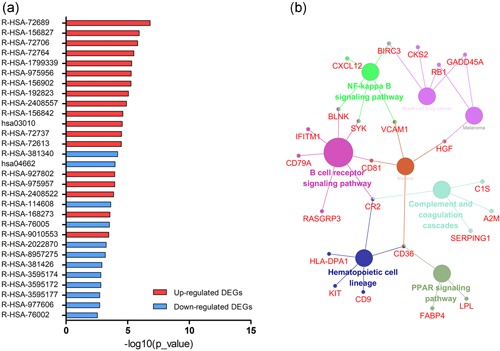
Figure 3.

Signaling pathway enrichment analysis of DEGs. (a) KEGG and REACTOME pathway enrichment of up‐ and downregulated DEGs. (b) Interrelation analysis of pathways via assessment of KEGG processes in ClueGO. DEGs, differentially expressed genes [Color figure can be viewed at wileyonlinelibrary.com]
