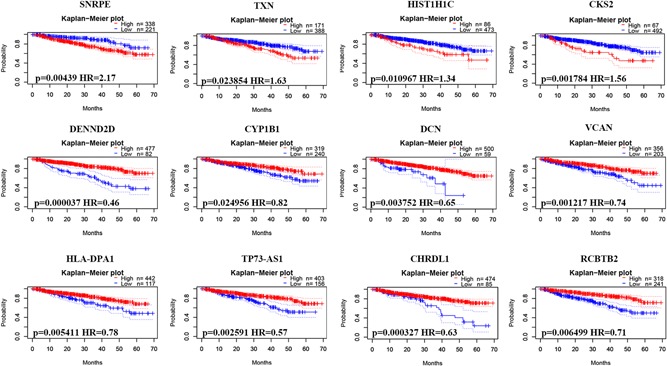
Figure 7.

Correlation between individual DEG expression and MM disease‐specific survival. Kaplan–Meier survival curves comparing high and low expression of DEGs in MM in PrognoScan, as based on the GSE2658 data set (n = 559). DEGs, differentially expressed genes; MM, multiple myeloma [Color figure can be viewed at wileyonlinelibrary.com]
