
Figure 2.
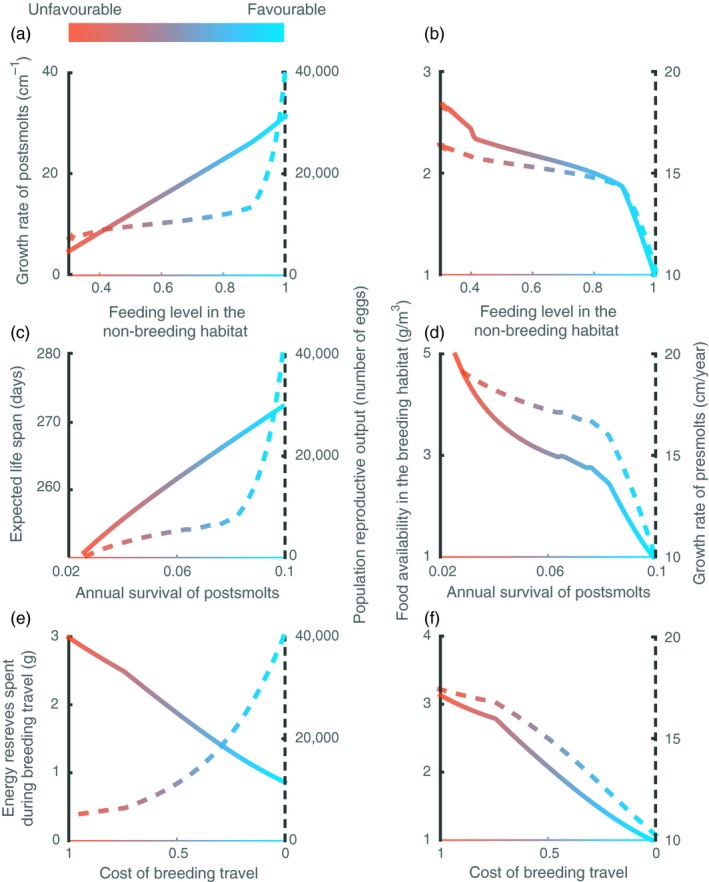
Effects of variation in feeding level in the non‐breeding habitat (top row), annual survival of postsmolts (middle row) and cost of the breeding travel (bottom row) on life‐history traits of postsmolts (growth rate, expected life span and proportion of energy reserves at the beginning of the breeding travel spent during travelling, solid lines in left column plots), population reproductive output (dashed lines in left column plots), food availability in the breeding habitat (solid lines in right column plots) and growth rate of presmolts (dashed lines in right column plots). Default values representing favourable conditions (feeding level in the non‐breeding habitat = 1, annual survival of postsmolts = 0.1 and cost of the breeding travel = 0) are used for parameters that are not varied. = 5 g/m3, other parameter values as in Table 2. The values correspond to the average population statistics after the transient dynamics have disappeared