
Figure 4.
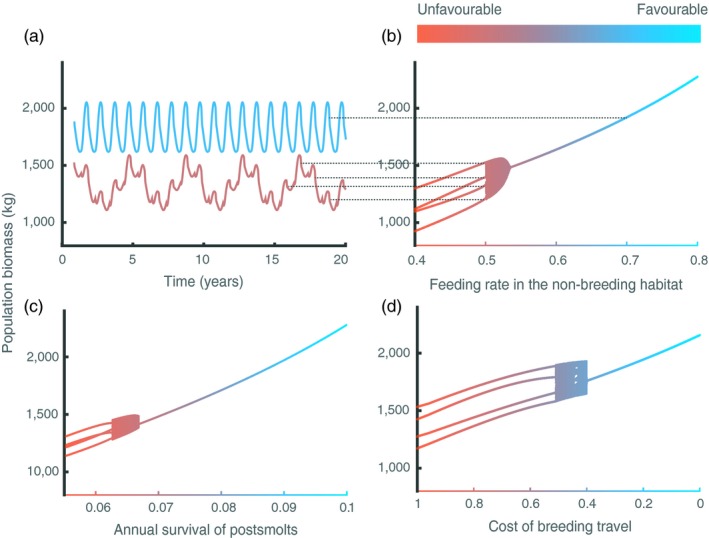
(a,b) Effect of feeding level in the non‐breeding habitat, (c) annual survival of postsmolts and (d) cost of the breeding travel on population biomass dynamics. (a) Annual fixed‐point dynamics (blue) and 4‐year cycles (brown) occur when feeding level in the non‐breeding habitat equals 0.7 and 0.5, respectively. Dotted lines in (a) indicate the time points in the dynamics at which the yearly census the population biomass occurs, resulting in the values shown in (b). In (b–d), irregular dynamics with a period of approximately 4 years occur in the transition from a regular annual cycle to regular 4‐year cycles. Default values representing favourable conditions (feeding level in the non‐breeding habitat = 1, annual survival of postsmolts = 0.1 and cost of the breeding travel = 0) are used for parameters that are not varied. = 8 g/m3, other parameter values as in Table 2. The values in plots (b–d) correspond to the population biomass census occurring every year at the time of hatching after the transient dynamics have disappeared