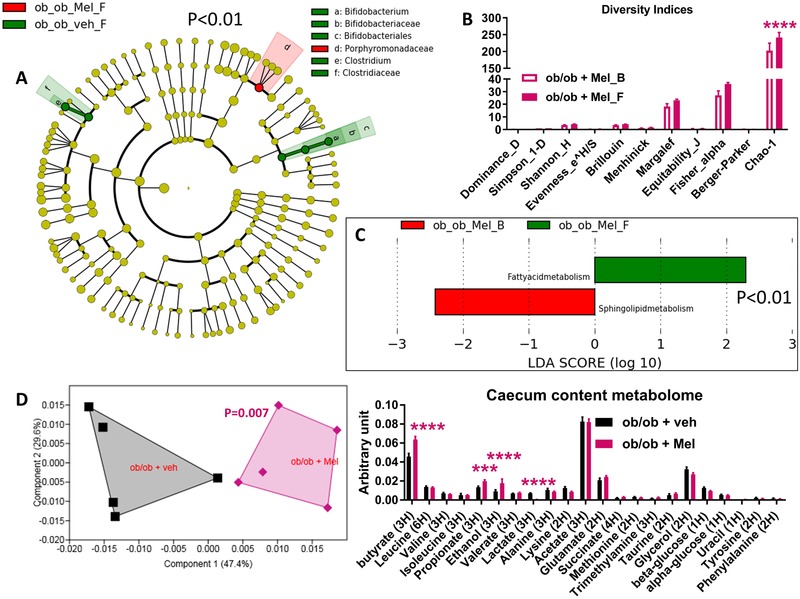
Figure 2.

Baseline (B) to final (F) point comparative analysis by LEfSe of the gut microbiota of ob/ob mice treated with either Melissa officinalis L. (Mel) extract or vehicle for two weeks. A: Cladogram showing bacterial taxa significantly higher in the group of mice of the same color, in the fecal microbiota between the baseline (ob_ob_Mel_B/veh_B) and the final (ob_ob_Mel_F/veh_F) points. B: Indices of gut microbiota diversity. C: LDA score for predictive microbial pathway identified via PICRUSt.22 D: PCA and histogram of the total metabolites in the caecum content; n = 5. ***p < 0.001, ****p < 0.0001, two‐way ANOVA followed by a two‐stage linear step‐up procedure of Benjamini, Krieger and Yekutieli to correct for multiple comparisons by controlling the False Discovery Rate (<0.05), for (D) a one‐way PERMANOVA with a Bonferroni correction was applied. (Since the cladogram does not show the ob_ob_Mel_B and ob_ob_veh_B groups, it means that these groups are characterized by no higher bacterial taxon compared to the final point of the related group).
