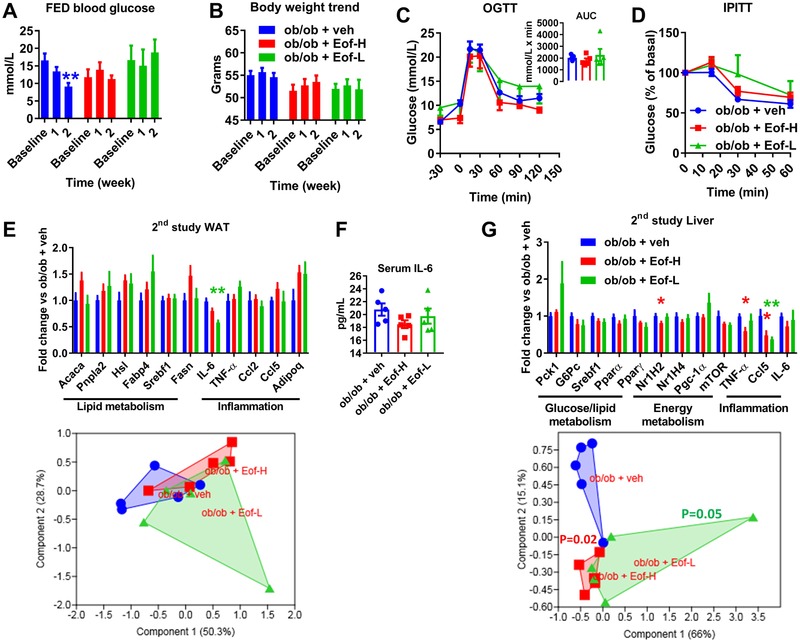
Figure 6.

Markers of glucose homeostasis and survey of body weight in ob/ob mice following a two‐week treatment with plant extract from Emblica officinalis Gaertn high‐dose (Eof‐H) or low dose (Eof‐L) or vehicle (veh). Kinetic analysis of A: fed blood glucose and B: body weight during the two weeks of treatment. C: oral glucose‐tolerance test (OGTT) with AUC (area under the curve) as inset. D: intraperitoneal insulin‐tolerance test (IPITT). Gene expression analysis of white adipose tissue (E) and liver (G) and related PCA as subpanel. F: Serum IL‐6 levels. Data are presented as mean ± SEM. n = 5; *p < 0.05, **p < 0.01, Kruskal‐Wallis test (A, E, G) plus two‐stage step‐up method of Benjamini, Krieger and Yekutieli correction for multiple comparisons by controlling the false discovery rate (FDR < 0.05) vs control group ob/ob + veh or 1‐PERMANOVA (G, lower panel) with Bonferroni's corrections.
