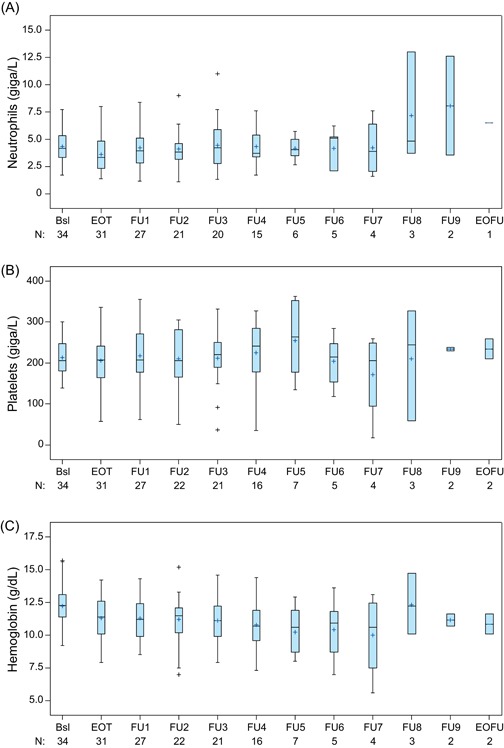
Figure 3.

Neutrophil (A), platelet (B), and hemoglobin (C) values over time, from baseline to end of active follow‐up. Note: Whiskers represent maximum and minimum values within limits of 1.5 quartile ranges above and below the upper and lower quartiles, respectively. Bsl, baseline; EOFU, end of active follow‐up; EOT, end of treatment; FU, active follow‐up; +, outlier value [Color figure can be viewed at wileyonlinelibrary.com]
