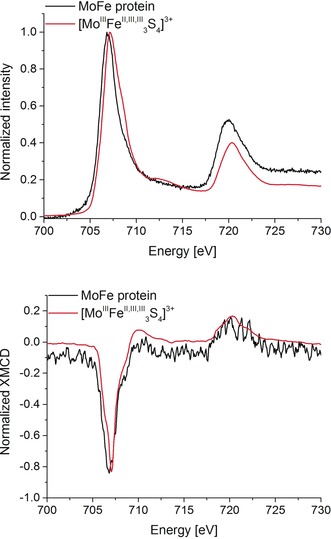
Figure 2.

Top: Normalized Fe L2,3‐edge XAS spectra of MoFe protein and the [MoIIIFe3S4]3+ model cubane. Bottom: Corresponding normalized Fe L2,3‐edge XMCD spectra obtained at 4 K and ±6 T magnetic field. [MoIIIFe3S4]3+ data, adapted from Ref. 14. The MoFe protein Fe L2,3‐edge XMCD spectrum was smoothed using the Savitzky–Golay algorithm (2nd order polynomial with 9 points window) in order to obtain better peak definition.
