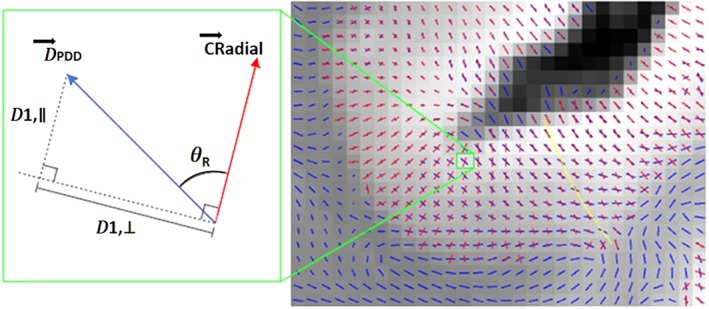
Figure 1.

Example of the cortical diffusion data for one representative region (right), including an illustrative voxel example of the derived diffusion‐based measures (left). A blue line indicates the principal diffusion vector in a voxel: on the right, only the direction is indicated, while on the left, the diffusion tensor component along the principal diffusion direction (PDD) vector (D PDD) is shown. A red line indicates the radial direction within the cortex (CRadial). The angle of radiality, AngleR (notation θ R), in a voxel is the angle between the red and blue lines. The perpendicular diffusivity, PerpPD (notation 𝐷1,⊥), was calculated by projecting D PDD onto the plane perpendicular to CRadial. The parallel diffusivity, ParlPD (notation 𝐷1,∥), was calculated by projecting D PDD onto the CRadial. Quantities were averaged along the radial cortical profile across the cortical layers, reflecting the minicolumnar organisation, as indicated for a set of voxels by the yellow line
