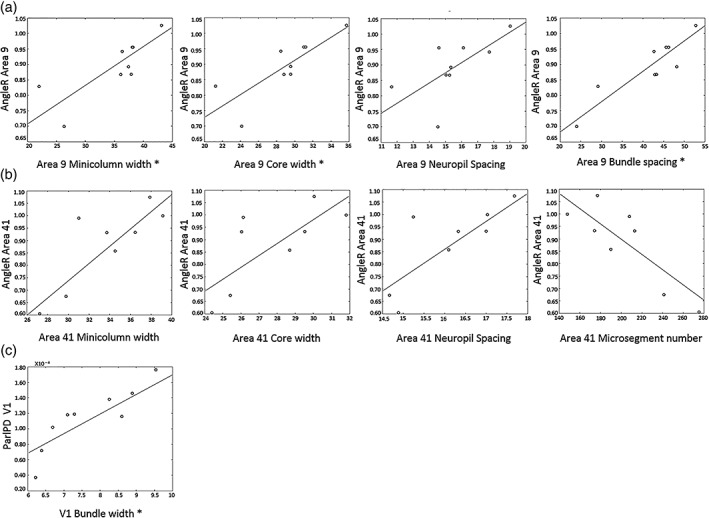
Figure 3.

Specific relationships between DTI and histology in MS brains (relationships are shown with p value <.05; relationships with P FDR < .05 surviving FDR correction are designated by * on the x axis)—See Section 4 for comments. AngleR values are expressed in radians (Θrad); ParlPD values are expressed in (×10−3 mm2/s)
