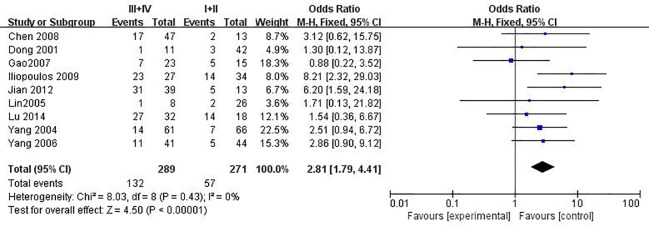
Fig 5. Funnel plots for associations of MGMT promoter hypermethylation with the FIGO stage of cervical cancer.
The squares represent the ORs for individual studies. The size of the square reflects the weight of included studies. Bars represent the 95% confidence intervals (CIs). The center of the diamond represents the summary effect size.

