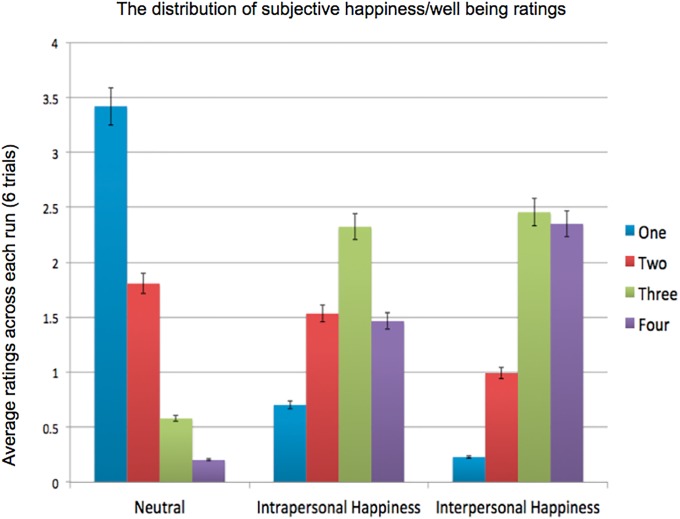
Fig 2. The distribution of subjective happiness/wellbeing ratings for each condition.
1 to 4 denotes the strength of happiness feeling invoked by the individual figure, and emphasized on how each picture make them feel, not evaluating on the people in the pictures. The average happiness ratings were as follows: Interpersonal (3.06) > Intrapersonal (2.69) > Neutral (1.56) conditions.

