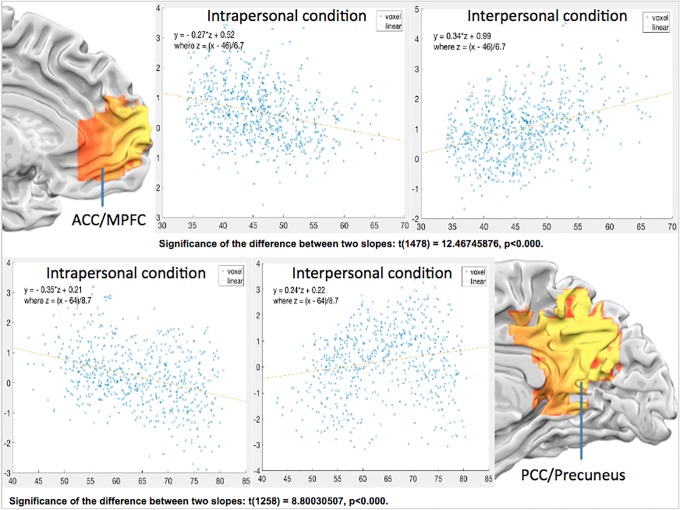
Fig 7. The voxel beta plots of the two core-happiness regions, pACC/MPFC (upper panel) and PCC/precuneus (lower panel), along the rostral-caudal (or y) axis, separately for intrapersonal (left) and for interpersonal (right) wellbeing conditions.
The two core regions were delineated via Neurosynth.org, and the numbers for horizontal axis corresponded to y-coordinate value of the activated voxels. The regression lines and equations were provided for visualization and comparison purpose: the voxels in both regions showed decreasing betas in intrapersonal, and increasing betas for interpersonal wellbeing, with increasing distance with AC (Anterior Commissure) point.

