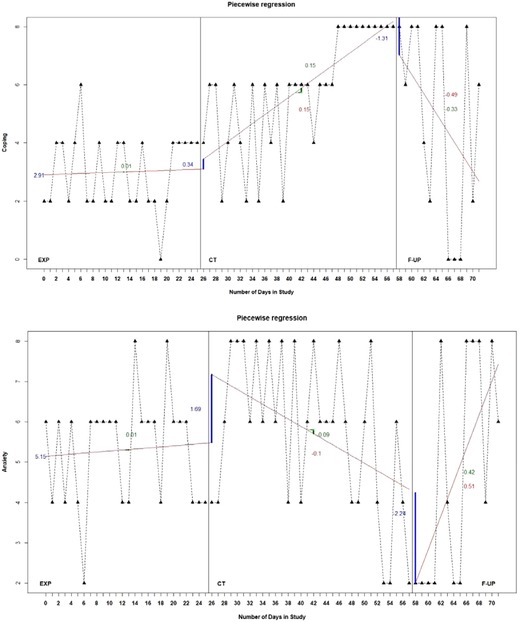
Figure 3.3.

Graphical displays of the piecewise regression estimates for the hypothesized mediator (Coping) and outcome (Anxiety) of the participant.
Note: The solid lines across phases indicate the estimated trend in the respective phase and the solid vertical lines at the start of each phase indicate the change in level between the respective phase and the previous phase. The blue numbers indicate the (change in) level, the green numbers indicate the within‐phase trend and the red numbers indicate the change in trend.
