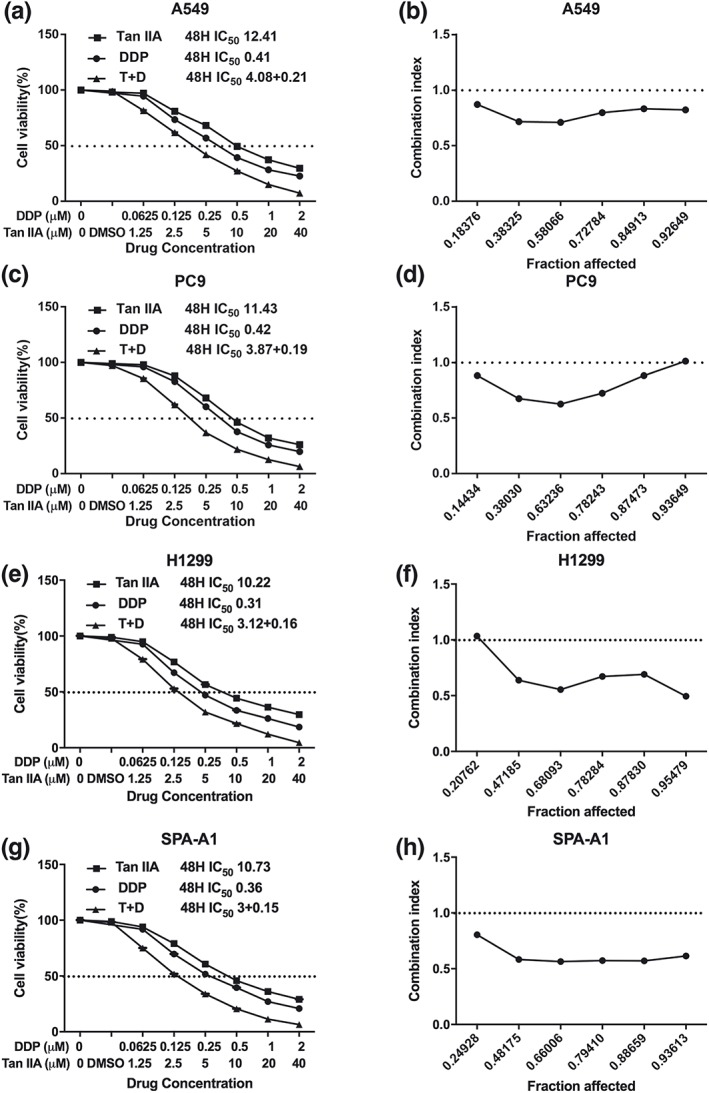
Figure 2.

Proliferative inhibitory effect of Tan IIA, DDP, and the combination treatment on non‐small‐cell lung cancer cells. Drug concentration‐cell viability curves were generated as the viable cell percentage based on the cell viability assay (a, c, e, g). Synergistic effects between Tan IIA and DDP are presented as Fa‐CI plots (b, d, f, h). Data are from three repeated experiments with quadruplicate wells (mean ± SD). *p < .05, **p < .01, or ***p < .001 versus the control group. DDP, cisplatin; Tan IIA, Tanshione IIA
