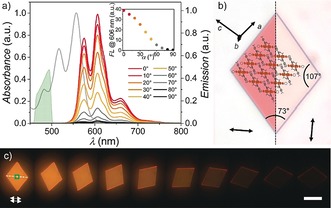
Figure 3.

a) Polarization‐dependent fluorescence spectra of a PBI 1 microcrystal on quartz displayed in (c). The gray solid line marks the absorption and the green area the excitation profiles of a band‐gap filter cube, respectively. Inset: Respective change of the emission strength at 606 nm. b) Optical microscopy images of a microcrystal for different polarizations (arrow=15 μm) of the transmitted light along (left) and perpendicular (right) to the long molecular axis including a schematic molecular arrangement. c) Fluorescence microcopy images of a microcrystal upon rotation with respect to parallel aligned polarizer (excitation) and analyzer (detection). The green square marks the area where the spectra were recorded. Scale bar=50 μm.
