Figure 4.

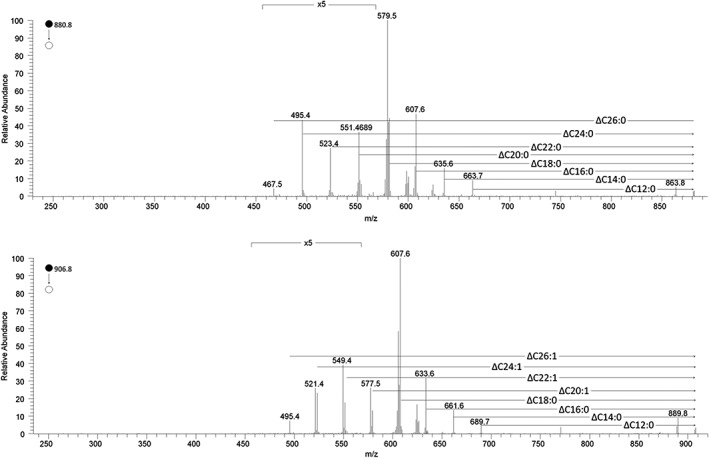
The MS2 spectra of TG(52:0) (top graph) and TG(54:1) showing the relative abundance of the different fatty acids contributing to these triglycerides. This has not previously been reported in human milk samples

The MS2 spectra of TG(52:0) (top graph) and TG(54:1) showing the relative abundance of the different fatty acids contributing to these triglycerides. This has not previously been reported in human milk samples