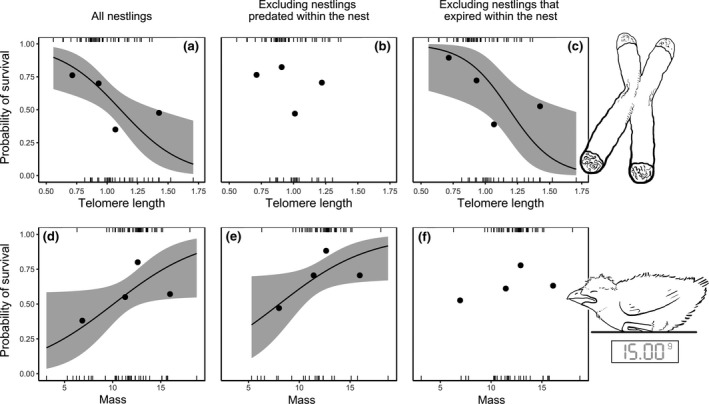
Figure 1.

Model predictions with 95% confidence intervals for the effects of top: day 4 RTL (T/S) and bottom: body mass (g) on survival to fledging. Left panel: all nestlings. Central panel: all nestlings except those classified as “predated”. Right panel: all nestlings except those classified as “expired”. Points show average survival probabilities for each quartile, which were made for graphical representation only. Statistical analyses were based on individual values, shown with marks at 1 (survived) and 0 (not observed to have fledged). Where the variable of interest was present in the top model set, its effect is shown by the mean predicted line from the top model when all other variables are held at their mean value
