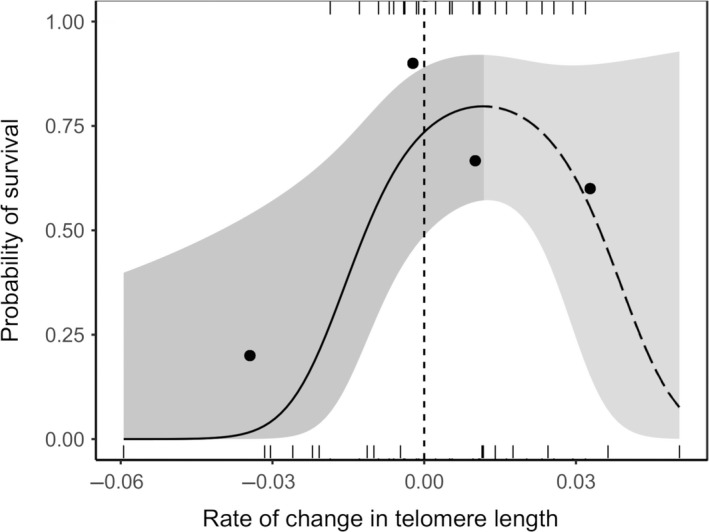
Figure 2.

Model predicted line with 95% confidence interval showing the quadratic relationship between a nestling's rate of change in RTL (T/S) per day between days 4 and 12 and their downstream survival to the start of the following breeding season (from Table 3a). Points show average survival probabilities for each quartile, which were made for graphical representation only. Statistical analyses were based on individual values, shown with marks at 1 (survived) and 0 (not observed the following season). Points to the left of the vertical dashed line indicate reductions in mean telomere length, while points to the right indicate increases in mean telomere length. The regression line presents the mean predicted relationship when body mass is held at its mean value. The regression line is solid prior to the peak of the quadratic as there is a significant positive relationship between the rate of change in telomere length and survival in this half of the data set (Table 3b). The regression line is dashed after the peak of the quadratic as there is no significant relationship in this half of the data set (there is no evidence of reduced survival among offspring that experience larger increases in mean telomere length; Table 3c)
