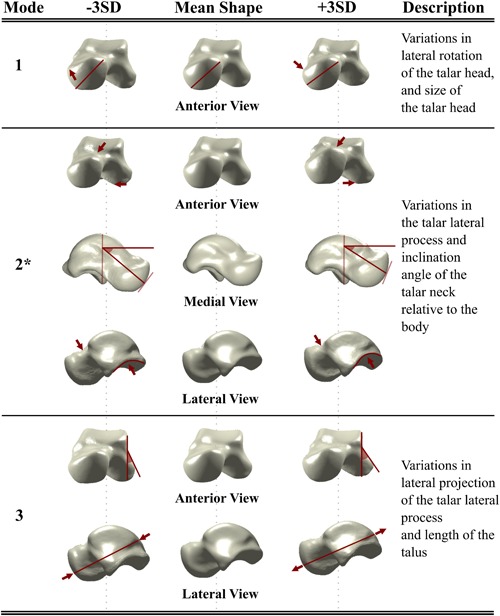
Figure 2.

The shape variations of the talus described by its first three shape modes. The red lines and arrows highlight the changes in the shape. The shape mode that is marked with a star was significantly different between the CAI patients and healthy controls (i.e., ipsilateral CAI vs. healthy controls, and CAI contralateral controls vs. healthy controls). CAI, chronic ankle instability; SD, standard deviation. [Color figure can be viewed at wileyonlinelibrary.com].
