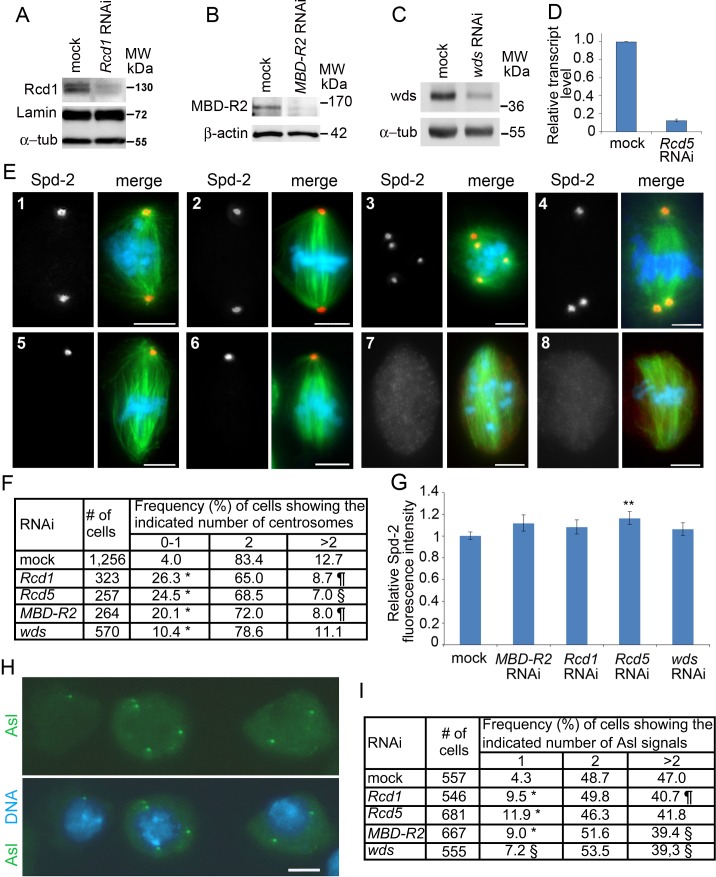
Fig 1. RNAi against Rcd1, Rcd5, MBD-R2 and wds impairs centriole duplication.
(A, B, C) Western blots of S2 cell extracts showing that RNAi against Rcd1, MBD-R2 or wds strongly reduces the levels of the corresponding proteins; the two bands detected by the anti-Rcd1 antibody likely correspond to different isoforms of this protein (FlyBase.org). Lamin Dm0 (Lamin), α-tubulin and β-actin are loading controls. (D) RT-qPCR results showing that RNAi against Rcd5 strongly reduces the level of its transcripts relative to a mock control that is set to 1. (E) Examples of cells showing different centrosome numbers. (E1, E2) Prometaphase (E1) and metaphase (E2) showing two regular centrosomes; (E3, E4) cell with basic karyotypes with 4 (E3) and 3 (E4) centrosomes; (E5-E8) prometaphases and metaphases showing a single centrosome (E5, E6) or no centrosomes (E7, E8). Scale bars, 5 μm. (F) Frequencies of prometaphases and metaphases with the indicated number of centrosomes; ¶, § and *, significantly different from control in the Chi-square test with p < 0.05, p < 0.01 and p < 0.001, respectively. (G) Quantitation of Spd-2 fluorescence in cells with two centrosomes (at least 106 centrosomes examined for each treatment). The mean fluorescence intensities measured in Rcd1, MBD-R2 and wds RNAi cells are not significantly different from control in the Wilcoxon Signed-Rank Test; in Rcd5 RNAi cells the centrosome fluorescence intensity is significantly higher than in control with p < 0.01 (**). (H) Example of interphase nuclei expressing Asl-GFP and showing (from left to right) 1, 4 and 2 Asl signals. Scale bar, 5 μm. (I) Frequencies of interphase cells with the indicated number of Asl-GFP signals; ¶, § and *, significantly different from control in the Chi-square test with p < 0.05, p < 0.01 and p < 0.001, respectively.

