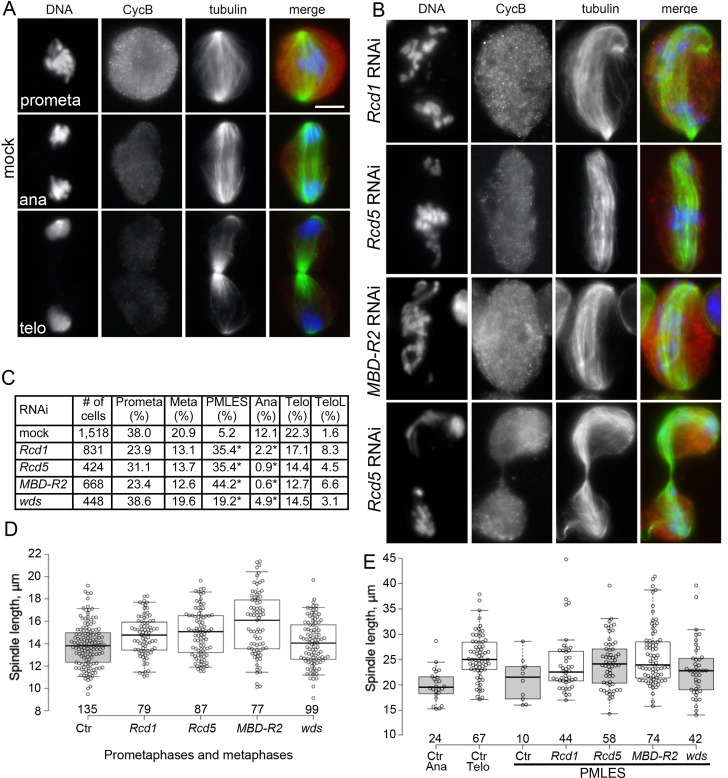
Fig 2. RNAi-mediated depletion of Rcd1, Rcd5, MBD-R2 or Wds disrupts chromosome segregation.
(A-B) Mitotic figures observed in mock-treated control cells (A), and in Rcd1, Rcd5 or MBD-R2 RNAi cells (B) stained for DNA (blue), α-tubulin (green) and Cyclin B (CycB; red). The cells shown in (B) are PMLES, namely prometaphase-like cells with elongated anaphase-like or telophase-like spindles showing high Cyclin B levels. Note that the cells with the arched anaphase-like spindles contain chromosomes comprised of both sister chromatids; see text for detailed explanation and S1 Fig for additional PMLES. Scale bar for panels A and B, 5 μm. (C) Frequencies of mitotic figures observed in Rcd1, Rcd5, MBD-R2 and wds RNAi cells and in mock-treated control cells. Prometa, prometaphases; Meta, metaphases; PMLES, as those shown in panel (B) and S1 Fig; Ana, anaphases; Telo, telophases; TeloL, telophases with lagging chromosomes. The Telo and TeloL classes could include real telophases or PMLES with telophase-like spindles and decondensed chromosomes (see panel B of this figure and S1D Fig). Scale bar, 5 μm. (D) Box-Whisker plots showing the length of prometaphase/metaphase spindles of mock-treated control (Ctr) and RNAi cells (Rcd1, Rcd5, MBD-R2 and wds). In Rcd1, Rcd5 and MBD-R2 RNAi cells, the spindle is significantly longer than in control cells in the Wilcoxon Signed-Rank Test (p < 0.01 in all cases); the spindles of wds RNAi cells are not significantly different from control spindles. (E) Box-Whisker plots showing the spindle length of anaphases (Ana), telophases (Telo) and PMLES observed in control (Ctr) cells, and of PMLES seen in Rcd1, Rcd5, MBD-R2 and wds RNAi cells. The PMLES spindle length in Rcd5 and MBD-R2 RNAi cells is not significantly different from the length of control telophase spindles in the Wilcoxon Signed-Rank Test, while the PMLES spindles of Rcd1 and wds RNAi cells are slightly but significantly shorter than the telophase spindles of control cells (p < 0.01) (see also S2 Data). The numbers below each box shown in D and E indicate the numbers of spindles measured.

