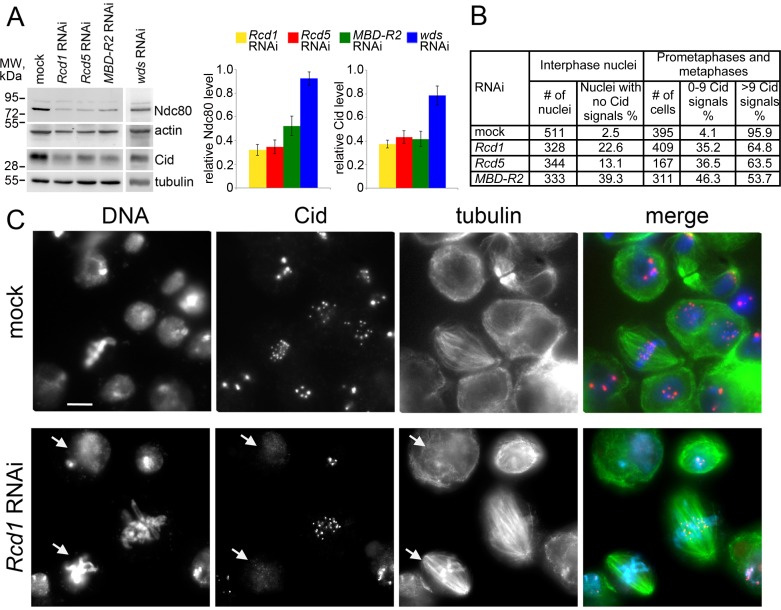
Fig 3. RNAi-mediated depletion of Rcd1, Rcd5 or MBD-R2 reduces the levels of Cid and Ndc80.
(A) Western blotting analysis and band intensity quantification relative to the control from 3 independent experiments showing that in Rcd1, Rcd5, MBD-R2 and wds RNAi cells the Cid level is reduced to 38%, 43%, 42% and 78% of the control level, respectively. In cells depleted of Rcd1, Rcd5 or MBD-R2, Ndc80 is reduced to 32%, 35% and 53% of the control level, respectively; in cells depleted of Wds the Ndc80 level is not changed compared to control. β-actin and α-tubulin are loading controls (see also S3 Data). (B) Quantification of the Cid signals in interphase and mitotic cells from control and Rcd1-, Rcd5- or MBD-R2-depleted cells. The frequencies of interphase nuclei with no Cid signals, and prometaphases/metaphases with 0–9 signals observed in Rcd1, Rcd5 or MBD-R2 RNAi cells are significantly higher than those detected in mock-treated cells (Chi-square test; in all cases p < 0.001). (C) Examples of interphase and dividing cells from mock-treated control and Rcd1 RNAi cultures stained for DNA (blue), Cid (red) and α-tubulin (green). Note that nearly all control cells display clear Cid signals; in contrast, some of the Rcd1-depleted interphase and dividing cells exhibit extremely weak or no Cid signals (arrows). Scale bar, 5 μm.

