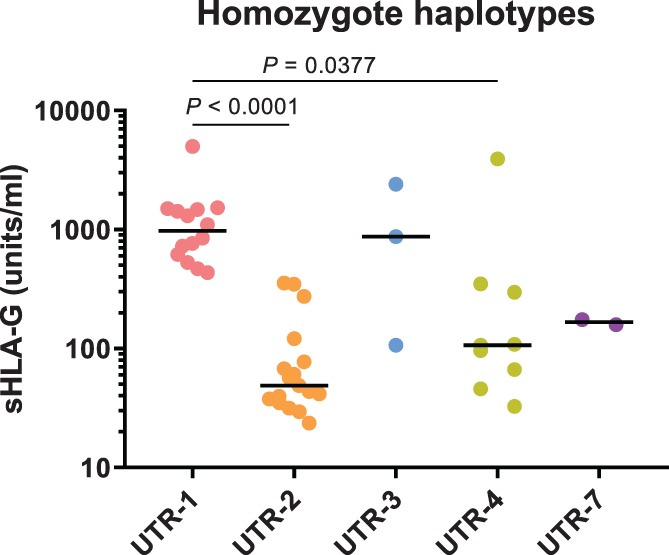
Figure 1.

sHLA‐G levels in SP for separate homozygous haplotypes. sHLA‐G levels in SP are significantly different for the homozygous HLA‐G 3′UTR haplotypes UTR‐1, UTR‐2, UTR‐3, UTR‐4 and UTR‐7 (P < .0001). Dunn's post hoc test showed that sHLA‐G levels in UTR‐1 and UTR‐2 (P < .0001) and UTR‐1 and UTR‐4 (P = .0377) were significantly different after correcting for multiple comparisons
