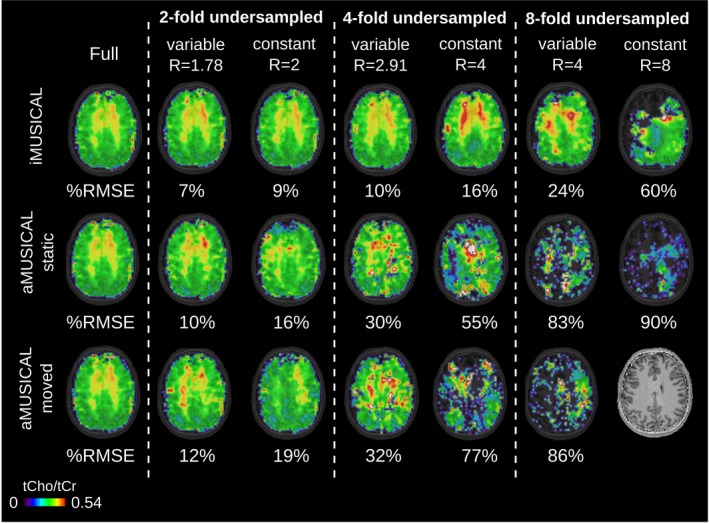
Figure 6.

Metabolic ratio maps (tCho/tCr) of volunteer 2 are presented for the different PI acceleration factors and calibration datasets, including %RMSE to the fully sampled ground‐truth. TR: 600 ms;, acquisition delay: 1.3 ms; 64 × 64 matrix interpolated to 128 × 128 for display. Using the interleaved iMUSICAL as calibration yielded significantly improved PI reconstructions compared to both aMUSICAL datasets. No map could be reconstructed for eight‐fold constant‐density undersampling for “moved” aMUSICAL PI, parallel imaging; %RMSE; percent root mean square error; tCho/tCr, total choline/total creatine; TR,repetition time
