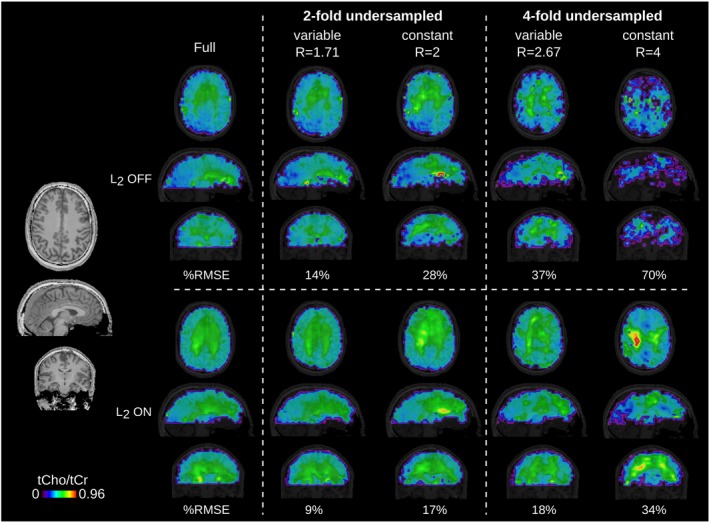
Figure 8.

The Tt/tk‐GRAPPA acceleration applied to a 3D stack‐of‐concentric‐rings MRSI dataset, including %RMSE to the fully‐sampled ground‐truth. Metabolic ratio maps of tCho/tCr are shown for volunteer 6 with and without L2 lipid regularization for acceleration factors up to 2. TR: 600 ms, acquisition delay: 1.3 ms, 48 × 48 × 31 matrix interpolated to 96 × 96 × 62 for display %MRSI, percent MR spectroscopic imaging; tCho/tCr, total choline/total creatine; TR, repetition time; Tt/tk‐GRAPPA, through‐time/through‐k‐space‐generalized autocalibrating partially parallel acquisition
