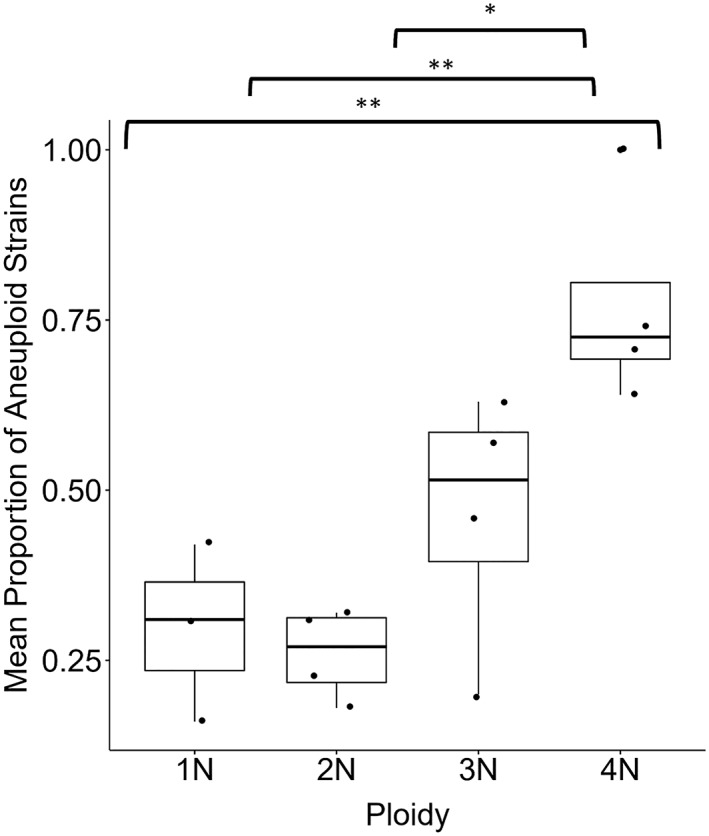
Figure 3.

Proportion of aneuploid to euploid strains as a function of ploidy. Data was extracted from four sources (Duan et al., 2018; Gallone et al., 2016; Peter et al., 2018; Zhu et al., 2016) with a total of 1,547 strains between them (158 haploid, 1,149 diploid, 104 triploid, and 131 tetraploid). The proportion of aneuploid to euploid strains was calculated per study, means and standard errors were calculated across studies. Analyses and graphs were made in R version 3.5.1 (Feather Spray; R Core Team, 2018) with the packages ggplot2 (Wickham, 2016), ggpubr (Kassambara, 2018), and magrittr (Bache & Wickham, 2014). (Kruskal–Wallis χ 2 = 9.86, p = .02, pairwise t‐test [4N] p < .05. * p < 0.05, ** p < .01)
