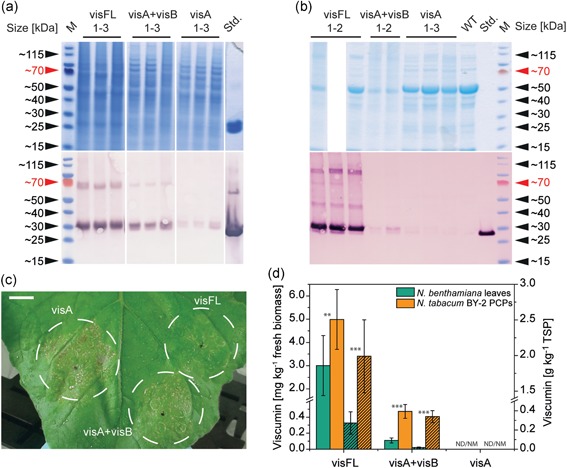
Figure 2.

Viscumin expression in Nicotiana tabacum BY‐2 PCPs and N. benthamiana leaves at 7 and 5 days postinfiltration (dpi), respectively. (a) Analysis of 15 µl samples derived from N. tabacum Bright Yellow 2 (BY‐2) plant‐cell packs (PCPs) by lithium dodecylsulfate–polyacrylamide gel electrophoresis (LDS‐PAGE) followed by staining with Coomassie Brilliant Blue (top) and a western blot using primary monoclonal antibody (mAb) TA‐5 and an alkaline phosphatase‐labeled goat antimouse IgG secondary antibody. (b) Corresponding analysis of 15 µl samples from Nicotiana benthamiana leaves. The LDS‐PAGE lane for visFL 3 is missing due to sample loss. M: Marker; 1–3: biological replicates; Std.: 500 ng of viscumin standard (nonglycosylated) purified from Escherichia coli . (c) Expression of viscumin in N. benthamiana leaves using constructs visA, visA + visB, and visFL. Bar = 10 mm. (d) Viscumin heterodimer yields relative to fresh biomass and TSP‐mass at 5 dpi in N. benthamiana leaves (n = 4) and at 7 dpi in N. tabacum BY‐2 PCPs (n = 11, model based, Tables S1 and S2) determined by surface plasmon resonance spectroscopy. Hatched columns indicate viscumin content per total soluble protein (TSP). Significance of differences between platforms: **p < .01, ***p < .001 (two‐sided Student's t test, α = .05) [Color figure can be viewed at wileyonlinelibrary.com]
