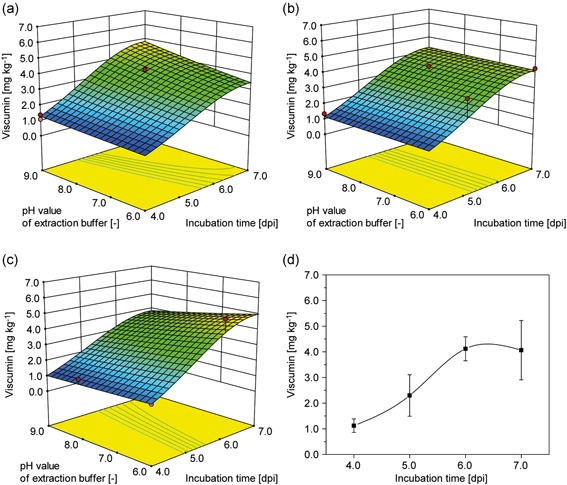
Figure 3.

Response surfaces representing the viscumin concentration as a function of the extraction buffer pH and conductivity as well as the incubation time following infiltration. Extraction buffer conductivity: (a) 15 mS/cm. (b) 35 mS/cm. (c) 55 mS/cm. (d) Viscumin concentration as a function of incubation time following Agrobacterium tumefaciens infiltration averaged over all factor levels (arithmetic mean ± standard deviation, 4 days postinfiltration [dpi] n = 26, 5 dpi n = 12, 6 dpi n = 11, 7 dpi n = 21) [Color figure can be viewed at wileyonlinelibrary.com]
