Figure 4.

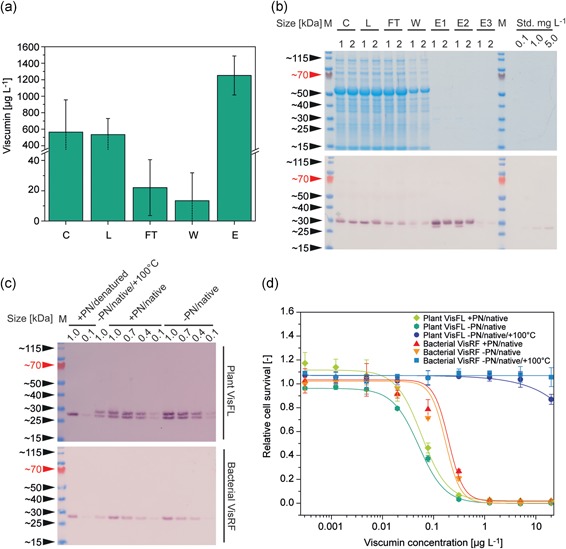
Viscumin purity during product purification and final product cytotoxicity. (a) Viscumin concentration determined by surface plasmon resonance spectroscopy (arithmetic mean [AM] ± standard deviation [SD]). (C) centrate (supernatant; n = 1, N = 2); L, affinity chromatography load (n = 4, N = 8); FT, flow‐through (n = 4, N = 8); W, wash (n = 4, N = 8); E, elution fraction 1 (n = 4, N = 8). (b) Protein composition analysis of 15 µl purification intermediates samples by lithium dodecylsulfate–polyacrylamide gel electrophoresis followed by staining with Coomassie Brilliant Blue (top) and a western blot using primary mAb TA‐5 and an alkaline phosphatase‐labeled goat antimouse IgG secondary antibody. M: protein size marker; Numbers 1 and 2 in (b) indicate samples from biological replicates; Std.: nonglycosylated viscumin purified from Escherichia coli. (c) Western blot analysis of viscumin treated with PNGaseA for de‐glycosylation; Plant visFL: full‐length viscumin purified from Nicotiana benthamiana; Bacterial VisRF: Refolded viscumin (nonglycosylated) purified from E. coli; +PN: samples with PNgaseA; −PN: samples without PNGaseA; denatured/native: reaction condition for PNGaseA treatment; +100°C: sample was boiled after PNGaseA treatment; 0.1–1.0: sample dilution factor. (d) 2,3‐bis(2‐methoxy‐4‐nitro‐5‐sulfophenyl)‐5‐[(phenylamino)carbonyl]‐hydroxide (XTT)‐cytotoxicity assay of PNGaseA‐treated plant VisFL and bacterial VisRF in human cell line THP‐1 visualized as cell survival relative to a zeocin positive control (no survival) and 1.75 µl de‐glycosylation buffer negative control (full survival; AM ± SD, n = 3) [Color figure can be viewed at wileyonlinelibrary.com]
