
Figure 1.
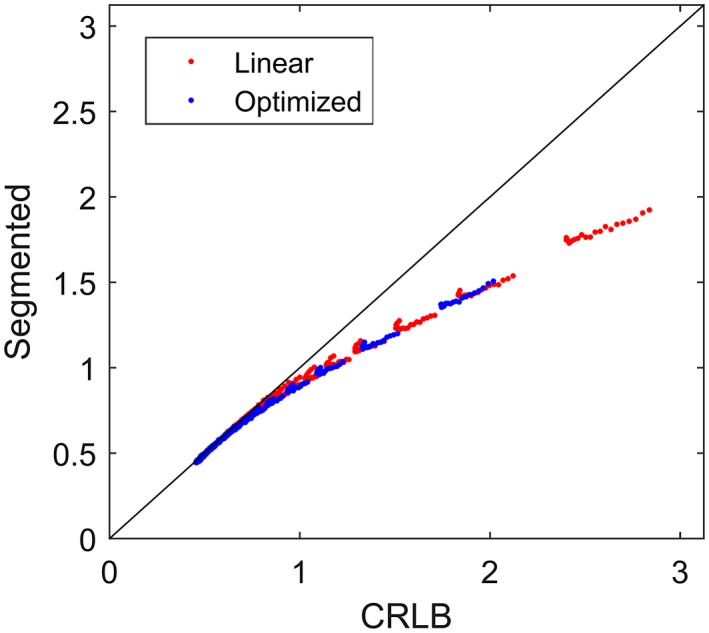
Comparison between estimation variability based on CRLB and segmented model fitting based on simulated data with D* = 50 µm2/ms. The red and blue markers show results based on the linear and optimized b‐value schemes, respectively. Each data point represents the total relative error (Equation 12 and its equivalent measure derived from segmented model fitting) for a given combination of D and f. Note the monotonic behavior of the data points. The line of unity is shown in black. Supporting Information Figures S1 and S2 show the corresponding plots based on data with D* = 20 µm2/ms and D* = 10 µm2/ms respectively. CRLB, Cramer‐Rao lower bound