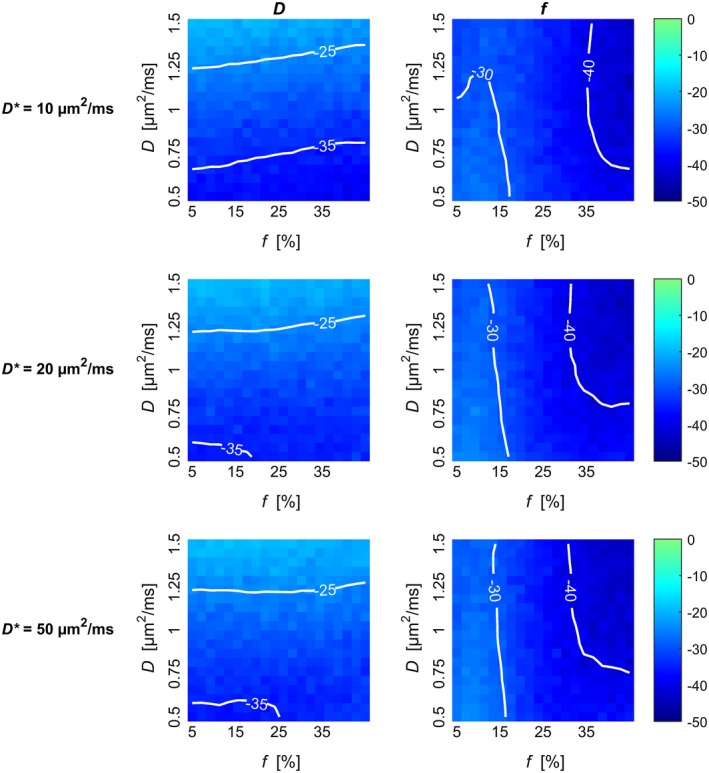
Figure 2.

Relative difference between estimate standard deviation observed with the linear and the optimized b‐values schemes. The relative difference for estimation of D (left column) and f (right column) from simulated data is plotted for each combination of D, f, and D*. Negative values imply less variability with the optimized b‐value scheme. Contours are superimposed on the color maps for improved visualization. Plots showing the estimation variability of each b‐value scheme separately are shown in Supporting Information Figures S3 to S5
