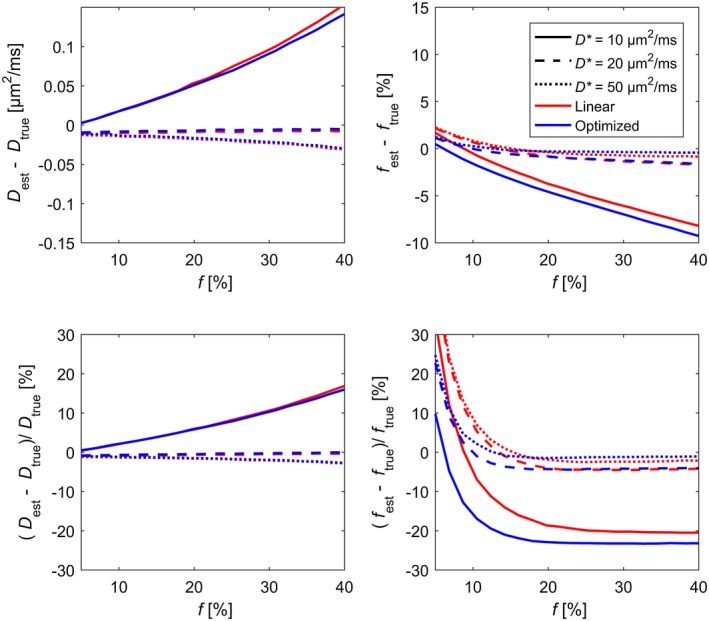
Figure 3.

Estimation bias for estimation of D (left column) and f (right column) from simulated data based on the two studied b‐value schemes plotted versus true values of f for different values of D*. The top row shows bias in absolute units, while the bottom row shows relative bias. The plotted bias is an average across the simulated values of D. Plots showing the joint dependence on D and f are found in Supporting Information Figures S6 to S8
