
Figure 4.
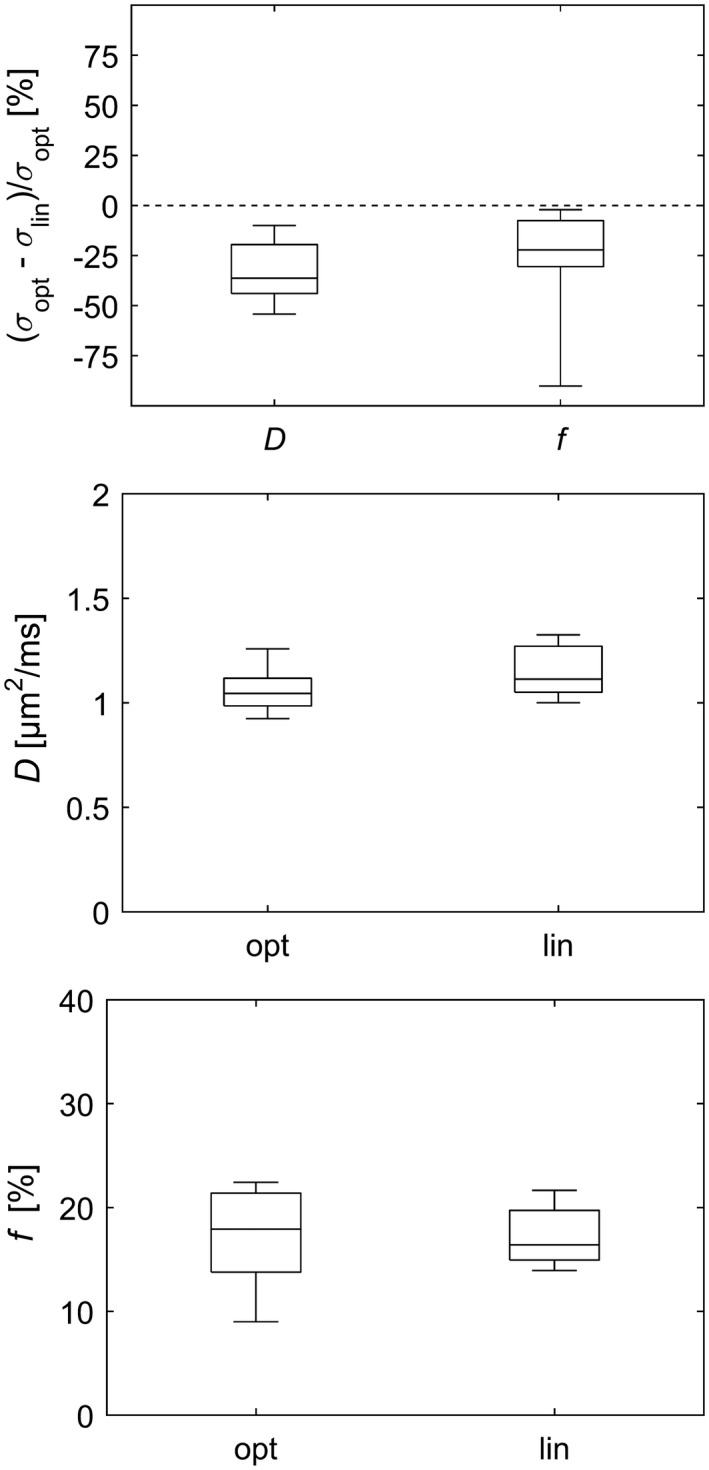
Comparison of b‐value schemes for in vivo data with respect to standard deviation of parameter estimates (top plot) and with respect to the estimated diffusion coefficient (middle plot) and the estimated perfusion fraction (bottom plot). The box plots show the distribution across subjects of ROI median of either parameter estimate variability or parameter estimate, depending on the context. The whiskers show the minimum and maximum values. Note that negative values in the top plot imply less variability with the optimized b‐value scheme. ROI, region of interest