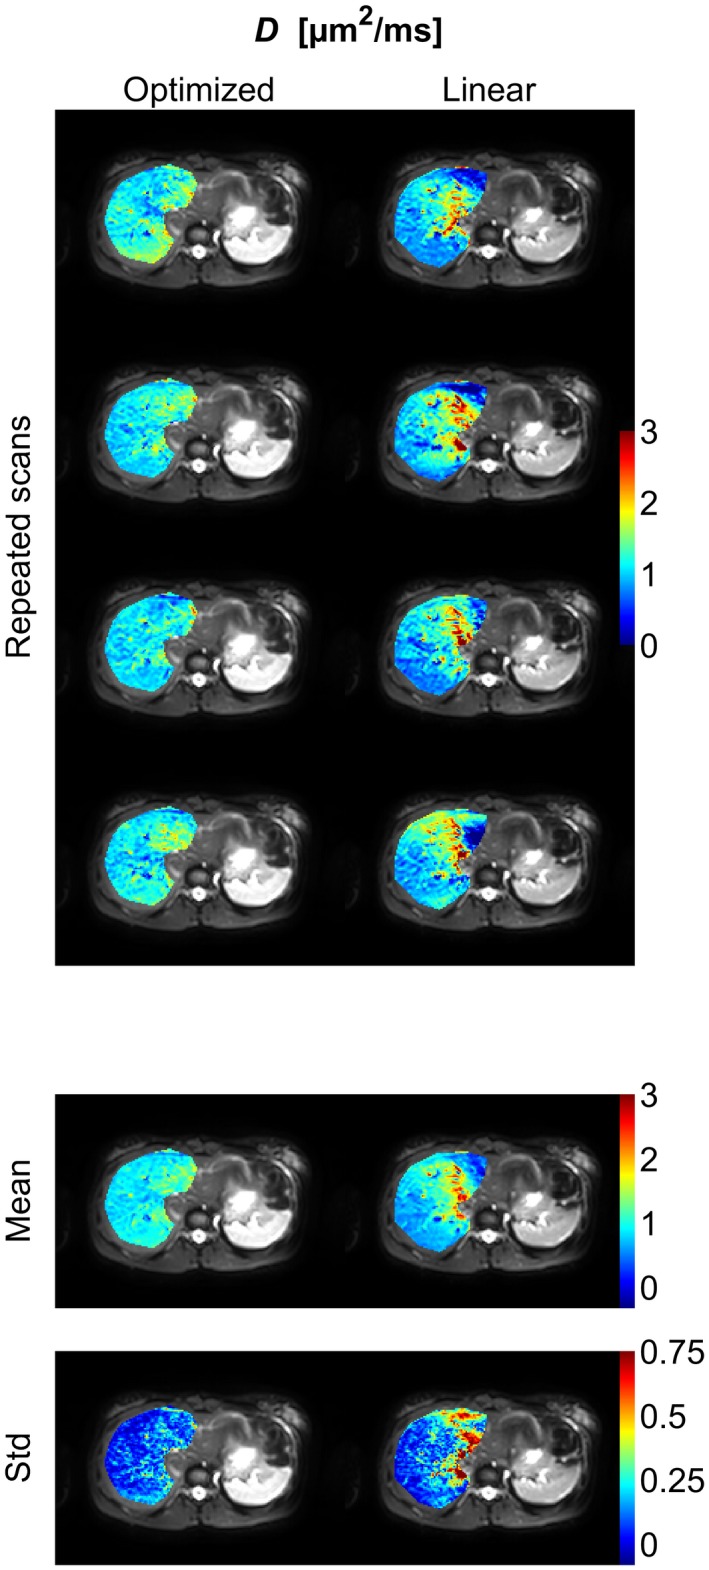
Figure 5.

Diffusion‐coefficient (D) parameter maps (color) of the right part of the liver superimposed on the b = 1 s/mm2 image (gray scale) from an example subject. The figure shows parameter maps from repeated scans as well as the mean and the standard deviation of these maps. Corresponding figures for the remaining subjects are found in Supporting Information Figures S9 to S14
