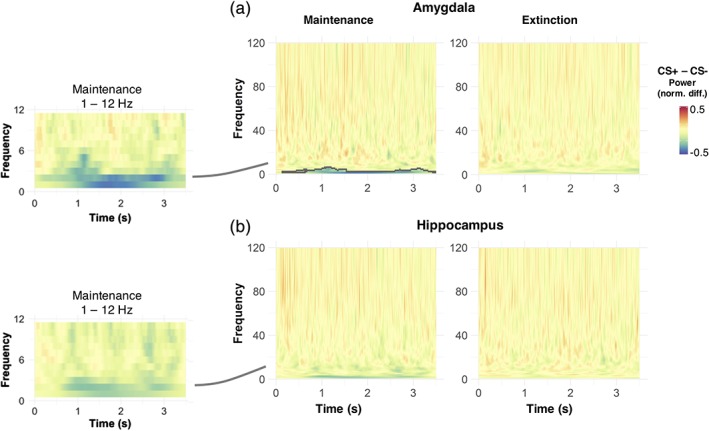
Figure 5.

Time–frequency decomposition across participants, for neural responses originating from the hippocampus and amygdala. The contrast between conditioned stimuli (CS+) and CS− stimuli revealed a sustained reduction in oscillatory power of low oscillations, which is mostly pronounced in the amygdala during the maintenance phase and lasts over the whole CS presentation. Grey lines in the full frequency plots to the right highlight time‐frequency clusters with significant differences between CS+ and CS− stimuli (unpaired t tests, corrected by random permutations at the cluster level, p = .03). To account for interindividual differences in the strength of reconstructed oscillations, all plots are normalised by the maximum single‐trial power value within each participant. Plots to the left illustrate the mean power difference over a smaller frequency range (1–12 Hz) than the ones to the right, for display purposes [Color figure can be viewed at http://wileyonlinelibrary.com]
