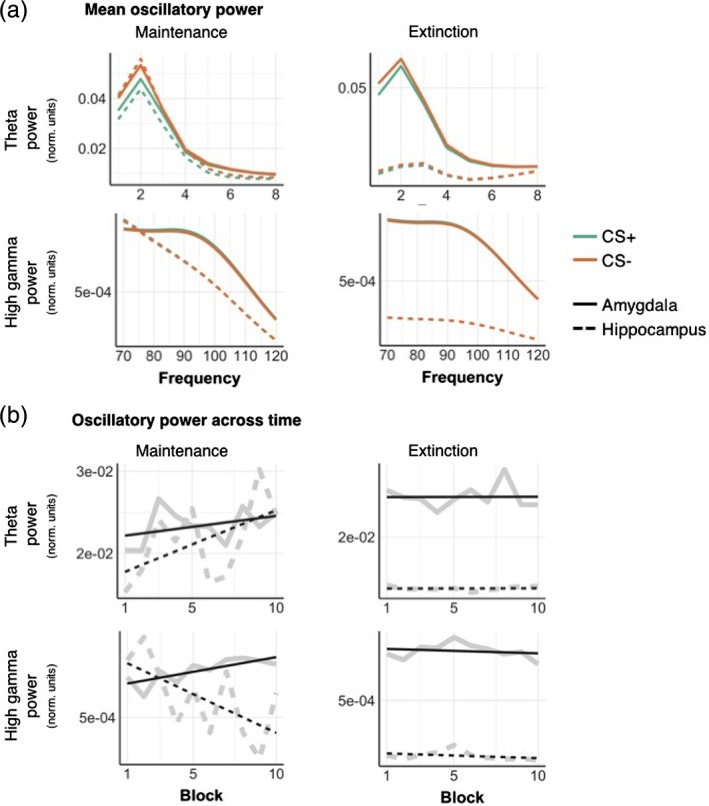
Figure 6.

Mean oscillatory power in theta and high gamma frequency bands for CS+ and CS−, reconstructed from sources in the hippocampus (dashed) and amygdala (full lines). (a) Mean theta (1–8 Hz) power was higher for CS−compared to CS+ stimuli, in both the hippocampus and amygdala, during maintenance and extinction phases. In the high gamma band (70–120 Hz), oscillatory power was greater in amygdala than hippocampus, regardless of condition. (b) Mean power for each block, experimental phase and frequency band. All plots are normalised by the maximum single‐trial power value within each participant. Full grey lines represent a linear fit of the power values over time. Full results of the statistical comparison of these plots are displayed in Table 1. Single participant results are displayed in Supporting Information 3 [Color figure can be viewed at http://wileyonlinelibrary.com]
