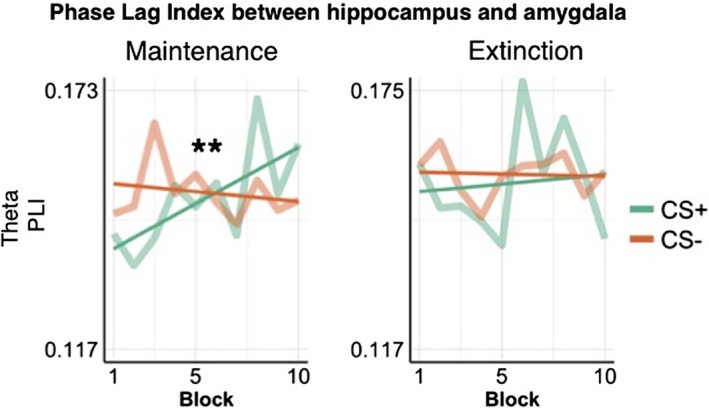
Figure 7.

PLI between the hippocampus and amygdala across experimental blocks. The PLI showed a time by CS interaction during the maintenance phase only (F(1,3916) = 5.23, p = .02), due to an increase in neural synchrony in response to CS+ trials over the time course of the experiment. Straight lines represent a linear fit of the PLI over time. CS, conditioned stimuli; PLI, phase lag index [Color figure can be viewed at http://wileyonlinelibrary.com]
