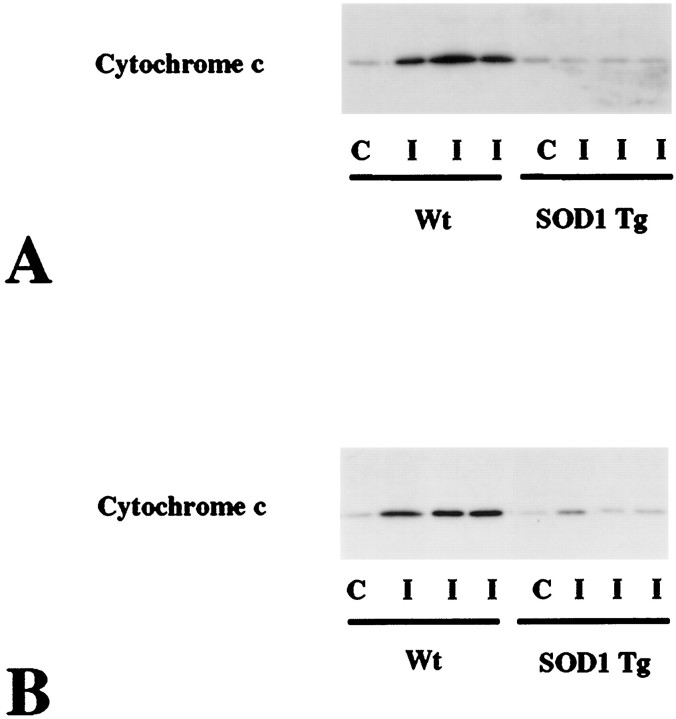
Fig. 3.
Western blot analysis of cytosolic cytochrome c in wild-type mice (Wt) and SOD1 Tg mice 2 (A) and 4 (B) hr after transient FCI. The data shown are from three different animals of each group. Protein (6.8 μg) was loaded per lane. C, Nonischemic control brain; I, ischemic brain. The mean optical density of the characteristic bands from the SOD1 Tg mice was significantly lower both 2 (A) and 4 (B) hr after transient FCI compared with that of the wild-type mice, indicating that cytosolic redistribution of cytochrome c was significantly decreased in SOD1 Tg mice.

