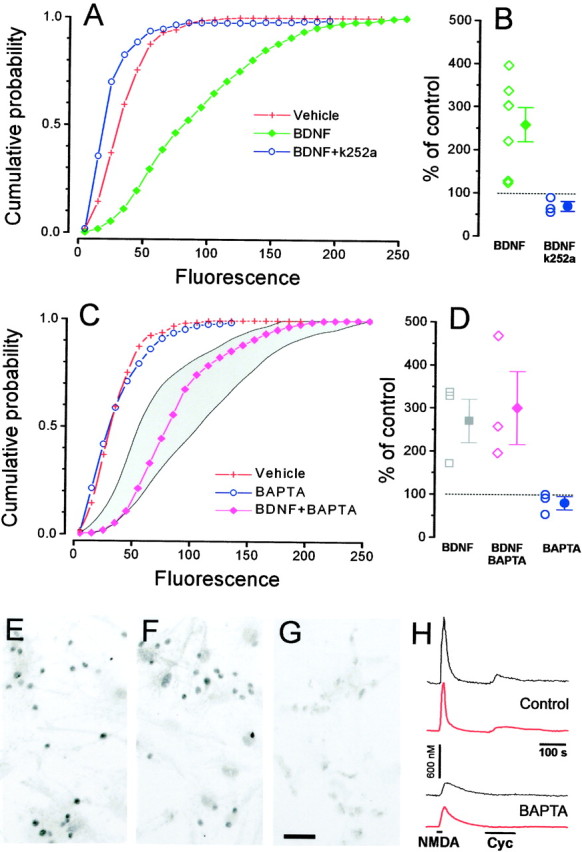
Fig. 4.

BDNF (15 min) induces CREB phosphorylation in cultured neurons from the visual cortex through a Trk-dependent and [Ca2+]i-independent pathway.A, BDNF (green, 1470 cells) increases pCREB staining with respect to the control (red, 811 cells). This effect is completely suppressed after incubation with the Trk inhibitor k252a (blue, 310 cells). B, Mean ± SEM and single results from separate experiments. (one-way ANOVA, p < 0.001; Tukey's post hoc test, BDNF vs vehiclep < 0.05; k252a vs vehicle p< 0.05). C, Incubation with the cell-permeable calcium chelator BAPTA-AM (blue, 660 cells) did not cause any significant change in the basal level of CREB phosphorylation. The effect of BDNF on CREB phosphorylation is not diminished after BAPTA-AM incubation (magenta, 707 cells). Theshaded area represents the confidence interval (95% level, t distribution) of pCREB staining distribution after induction with BDNF in normal conditions. D,Mean ± SEM and single results for experiments in which BDNF was applied in sister cultures loaded with BAPTA-AM or control (one-way ANOVA, p < 0.001; Tukey's post hoctest, BDNF + BAPTA vs vehicle, p < 0.05; BDNF + BAPTA vs BDNF, not different, p > 0.05; BAPTA vs vehicle, not different, p > 0.05).E–G, Representative fields for BDNF, BDNF + BAPTA, and control. Scale bar, 50 μm. H, Fura-2 imaging on sister cultures of those used for pCREB immunostaining shows that BAPTA-AM incubation strongly slowed calcium responses induced by stimulation with 20 μm NMDA and completely suppressed the calcium increases induced by 50 μm Cyc. The black traces are recordings from single neurons, whereas thered traces are the average responses of neurons in two representative fields (n = 18 cells above,n = 25 below).
