
Fig. 3.
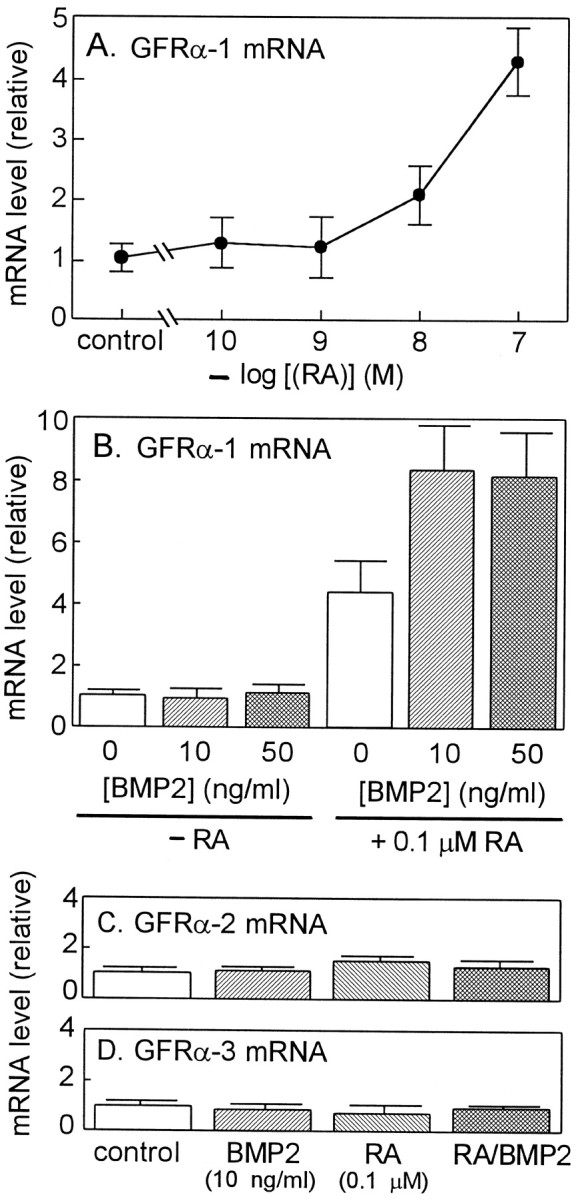
Effects of RA and BMP2 on the levels of GFR mRNAs in cultured SCG neurons. A, B, SCG neurons were treated with various concentrations of RA in the presence of 40 ng/ml NGF for 4 d before GFRα-1 mRNA levels were measured by RT-PCR. B, SCG neurons were treated with the indicated concentrations of BMP2 and 10−7m RA in the presence of 40 ng/ml NGF for 4 d before GFRα-1 mRNA levels were measured. C, D, SCG neurons were treated without or with 10−7m RA and 10 ng/ml BMP2 in the presence of 40 ng/ml NGF for 4 d before GFRα-2 and GFRα-3 mRNA levels were measured. Levels of mRNAs for GFRα-1, GFRα-2, and GFRα-3 were measured by quantitative RT-PCR as described in Materials and Methods. Eachcolumn represents the mean and range of two independent cultures. Note that among three GFRs, RA and RA–BMP2 treatments specifically and remarkably induced the level of GFRα-1 mRNA. Each value represents the mean and range of two independent RNA samples from the same series of culture. Each panel is representative of two independent experiments (independent series of culture) that gave similar results.