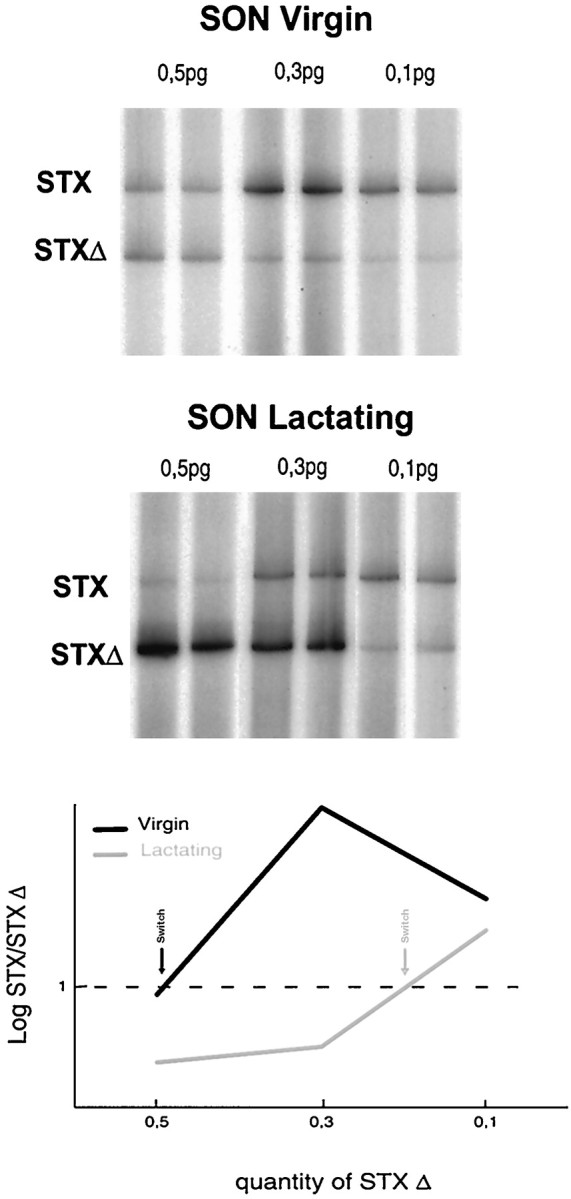
Fig. 3.

STX expression in the SON of virgin and lactating rats. Top, Total RNA was extracted from the SON of virgin rats and at day 10 of lactation. Competitive RT-PCRs were performed using γ-32P-ATP-labeled STX-specific primers with different amounts of STXΔ internal standard cRNA (0.5, 0.3, and 0.1 pg) and a constant amount of total SON RNA (5 μg). The reaction products were separated on an acrylamide gel, and the radioactivity incorporated into each band was determined using a Phosphorimager.Graph, Phosphorimager quantitative analysis of the above gels: to evaluate the relative STX mRNA levels in virgin and lactating SON, a competitive RT-PCR linear regression curve is constructed by plotting for each concentration of internal standard cRNA, and the ratios of log(cpm) are incorporated into STX versus STXΔ reaction products. The point of equivalence [log(cpm STX)/log(cpm STXΔ) = 1; indicated by arrows] switches from 0.5 pg of STXΔ for virgin SON to 0.2 pg for lactating SON, corresponding to a decrease of 60%.
