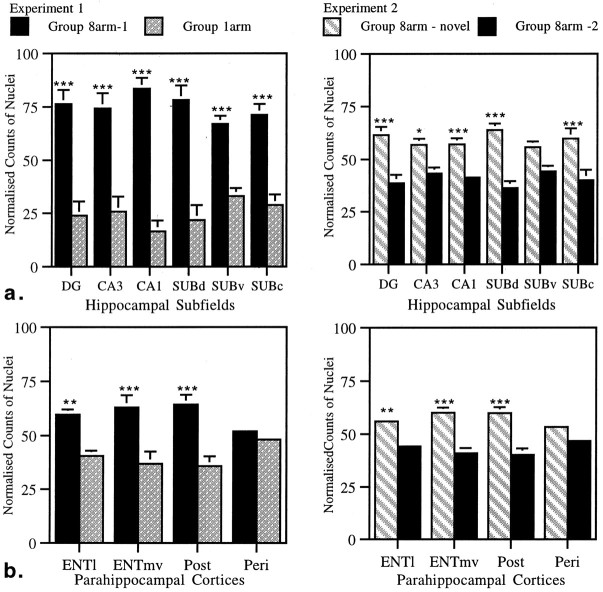
Fig. 3.
a, Normalized counts of Fos-stained nuclei for hippocampal subfields in Experiments 1 and 2.b, Normalized counts of Fos-stained nuclei for parahippocampal cortices in Experiments 1 and 2. Data are shown as means ± SE; where SE is very small, they are not visible on the graphs. All normalized scores sum to 100 (see Materials and Methods). See Figure 1 for abbreviations. Significance of differences in normalized counts: *p < 0.05, **p < 0.005, ***p < 0.001.

