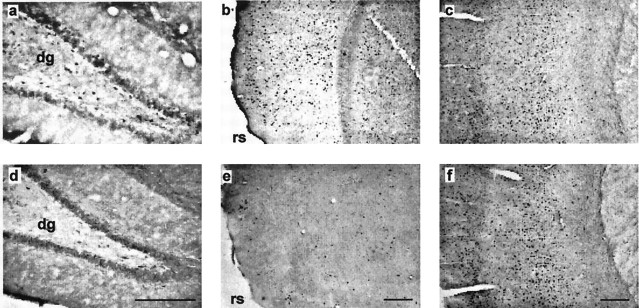
Fig. 4.
Photomicrographs of matched pairs of coronal sections from Experiment 1 showing Fos-stained nuclei in the dentate gyrus (a, d), postrhinal cortex (b, e), and somatosensory cortex (c, f). The top rowshows sections from the experimental condition (Group 8arm-1); thebottom row shows sections from the control condition (Group 1arm). The sections correspond to an AP level of −2.85 (a, d), −7.90 (b,e), and −1.53 (c,f) from bregma (Fig. 1). In the cortical sections (b, c, e,f), the superficial layers are on theleft. dg, Dentate gyrus;rs, rhinal sulcus. Scale bar, 500 μm.

