
Fig. 2.
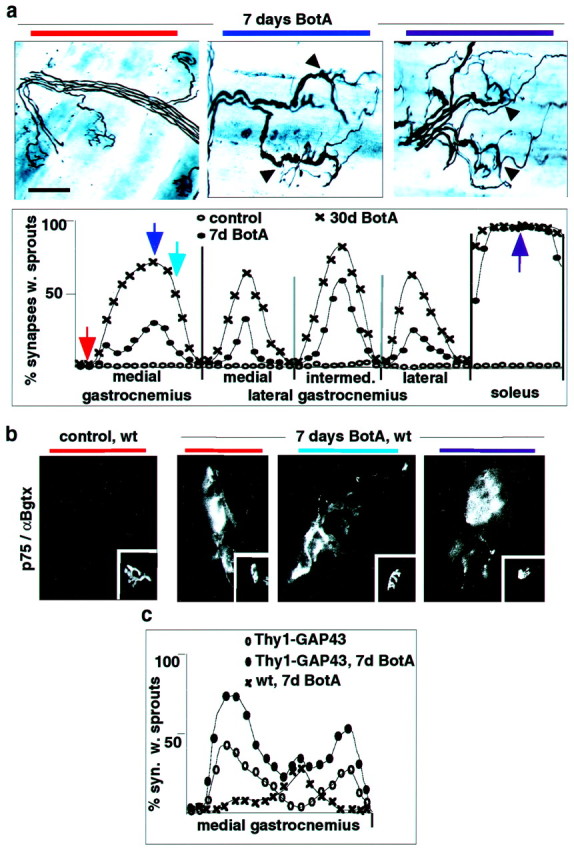
Profound differences in the growth response of neuromuscular synapse subtypes in response to paralysis and/or GAP43 overexpression. a, Distribution of synapses with sprouts in triceps surae of BotA-treated wild-type mice. Top row, Silver-esterase stains (arrowheads, sprouting synapses); bottom row, quantitative analysis as in Figure 1b (n = 4). Positional color code in the figure (horizontal bars) refers to the position of the arrows in the graph. b, Upregulation of tSC p75 immunoreactivity by BotA-induced paralysis at all types of triceps surae synapses (insets, α-bungarotoxin-positive synapses). c, Distribution of synapses with sprouts in MGC of Thy1-GAP43 mice, with and without BotA treatment. Scale bar: a, 55 μm; b, 25 μm.