
Fig. 3.
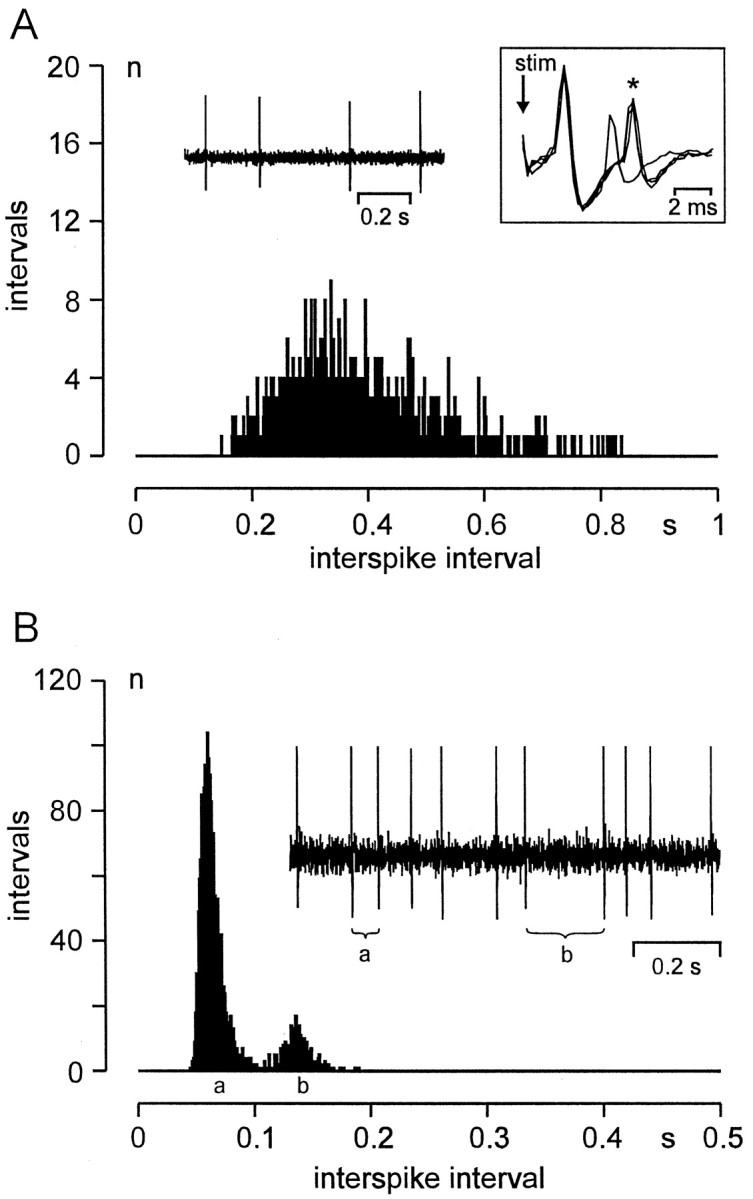
Representative examples of discharge patterns in DRG neurons with ongoing activity. Histograms show the distribution of temporal distances between successive spikes (interspike intervals); bin width, 1 msec. A, E1 neuron exhibiting an irregular discharge pattern and a unimodal distribution of interspike intervals. Left inset shows ongoing activity at low temporal resolution. Right inset shows the response of the unit (*) with a fixed latency after electrical stimulation: CV, 12.5 m/sec; note that immediately after a spontaneously occurring action potential the electrically evoked spike is missing because of to axonal membrane refractoriness. Ten days after nerve lesion.B, E2 neuron exhibiting bursting discharges. Intraburst (interburst) interspike interval marked with a(b) in the oscilloscope trace; corresponding peaks of the histogram likewise marked with a andb. Seven days after nerve lesion, CV 14.8 m/sec.