
Fig. 4.
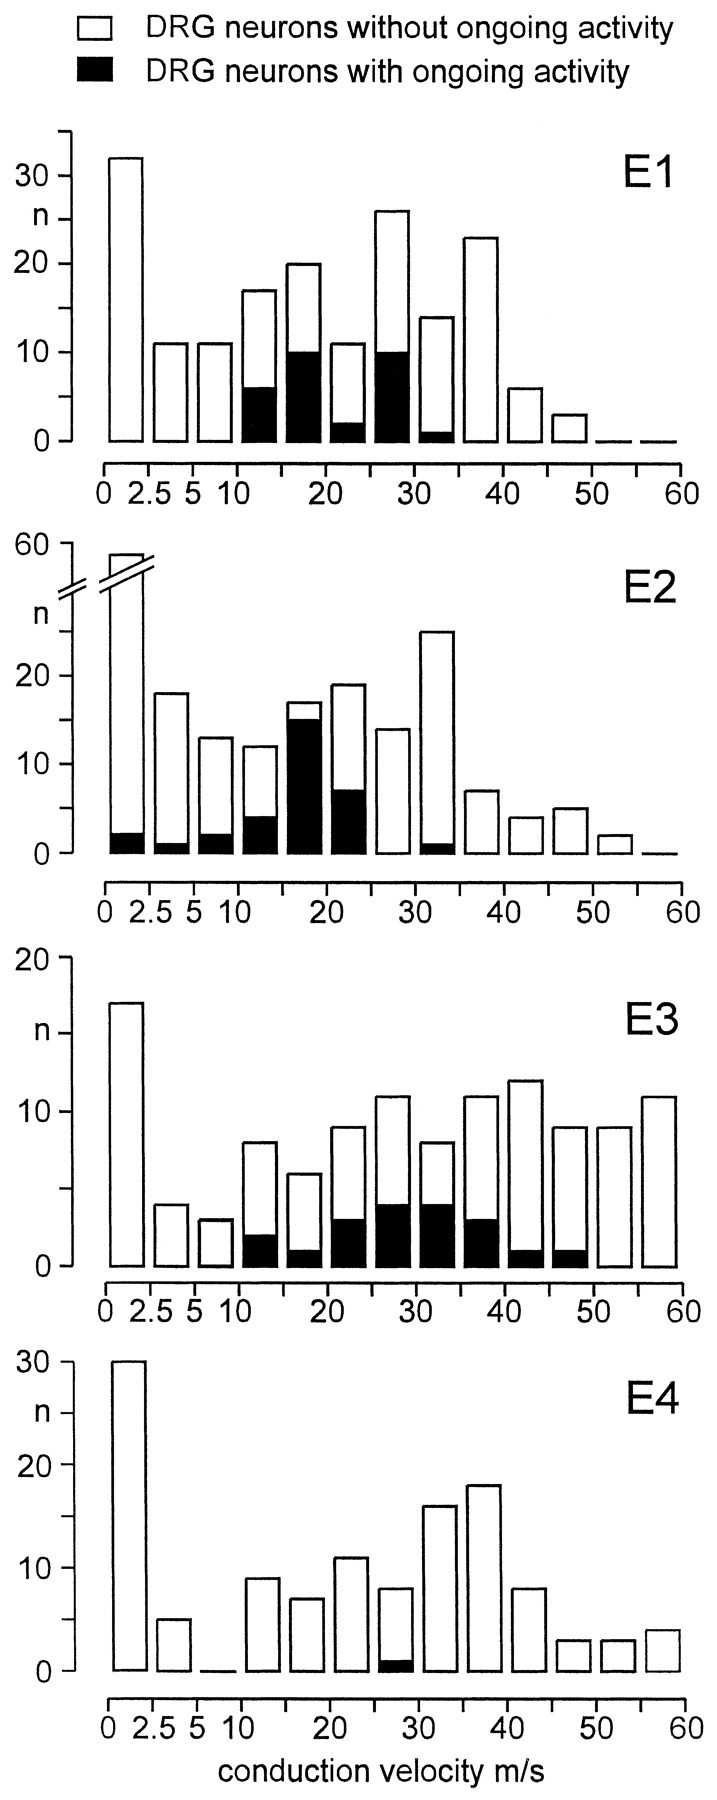
Conduction velocity distribution of DRG neurons projecting into the gastrocnemius soleus nerve in experimental groups E1–E4, separately for neurons with and without ongoing activity. Experimental groups: E1, GS and sural nerve cut;E2, tibial, peroneal, sural, and GS nerve cut;E3, GS nerve intact, tibial, peroneal, sural nerve cut;E4, no previous nerve lesion.