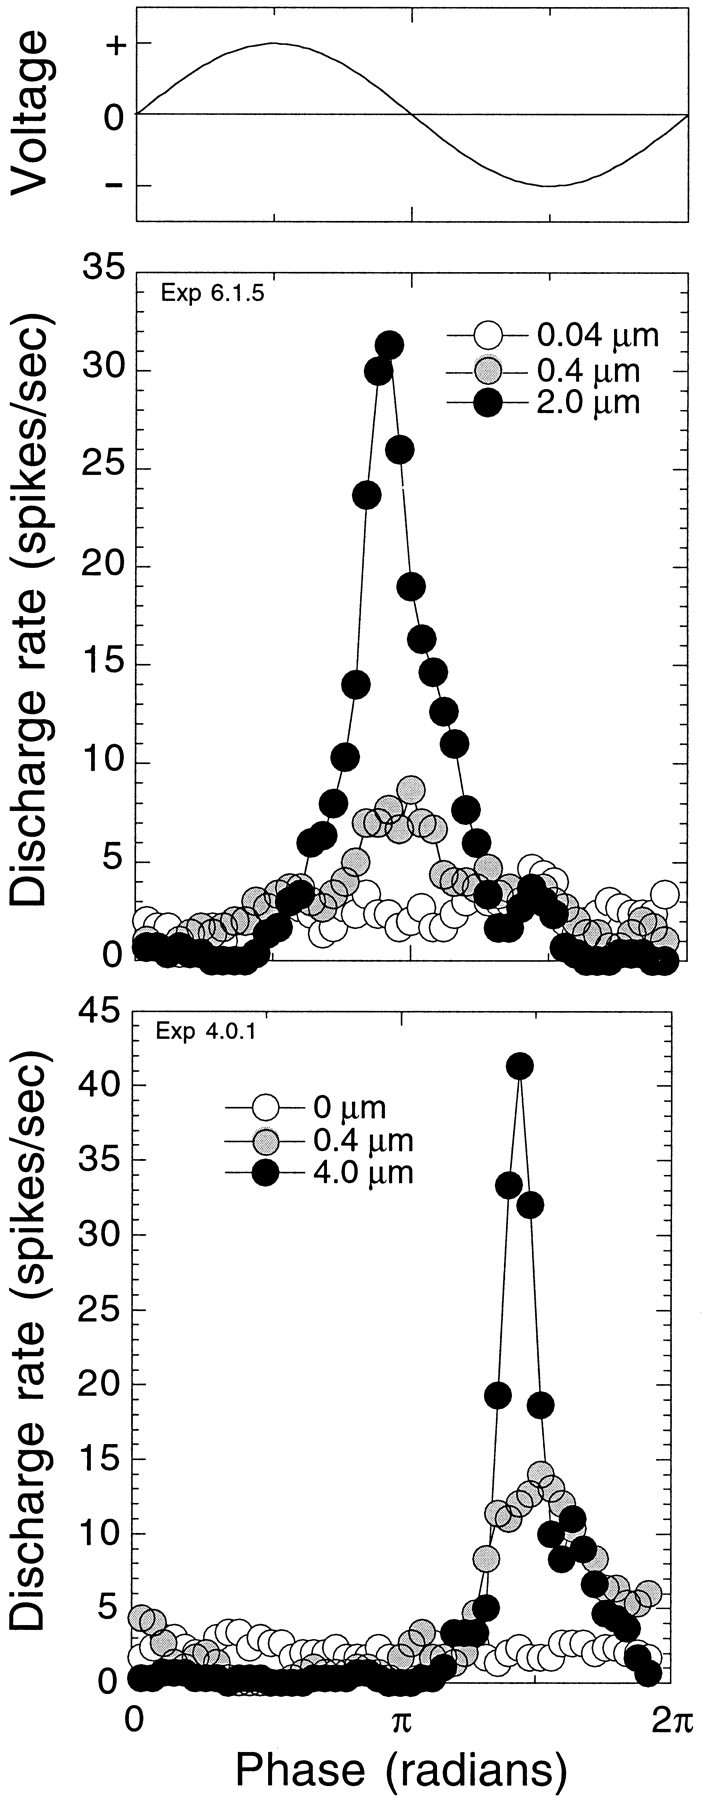
Fig. 1.

Afferent nerve fibers of the lateral line organ discharge synchronously to mechanical movement of the cupula. Period histograms represent 10 presentations of sinusoidal cupular displacement at the characteristic frequency of the fiber. Voltage applied to the piezoelectric device is shown in the top. The bottom panels indicate responses in two different fibers to different displacement levels. At the lowest displacement levels (opencircles), responses were below the synchronization threshold of the fibers. At moderate displacement levels (filled gray circles), responses were synchronized to the stimulus waveform but below the rate threshold of the fibers. At the highest displacement levels (filled black circles), responses evoked increases in afferent discharge.
