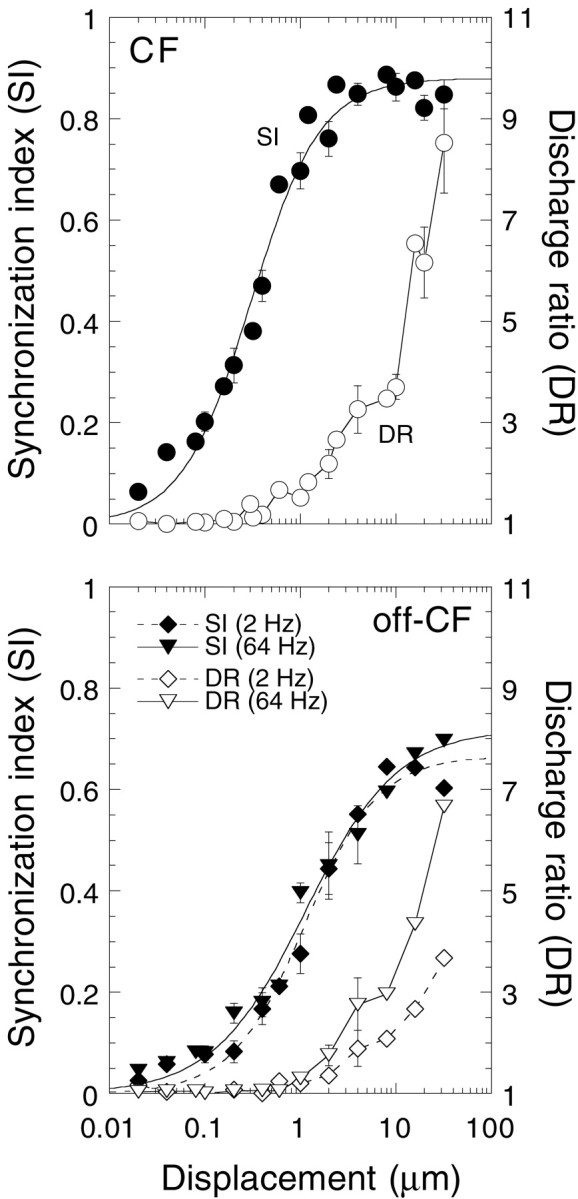
Fig. 2.

Both SI and DR increased with displacement. Data are summarized from 20 animals. Not all displacement levels were used in all experiments. Mean ± SE are plotted for displacements with three or more data points. DR was calculated by dividing the discharge rate during stimulus presentation by the discharge rate immediately after the stimulus presentation. Sigmoidal curves were fit to the SI data using a least squares regression analysis.
