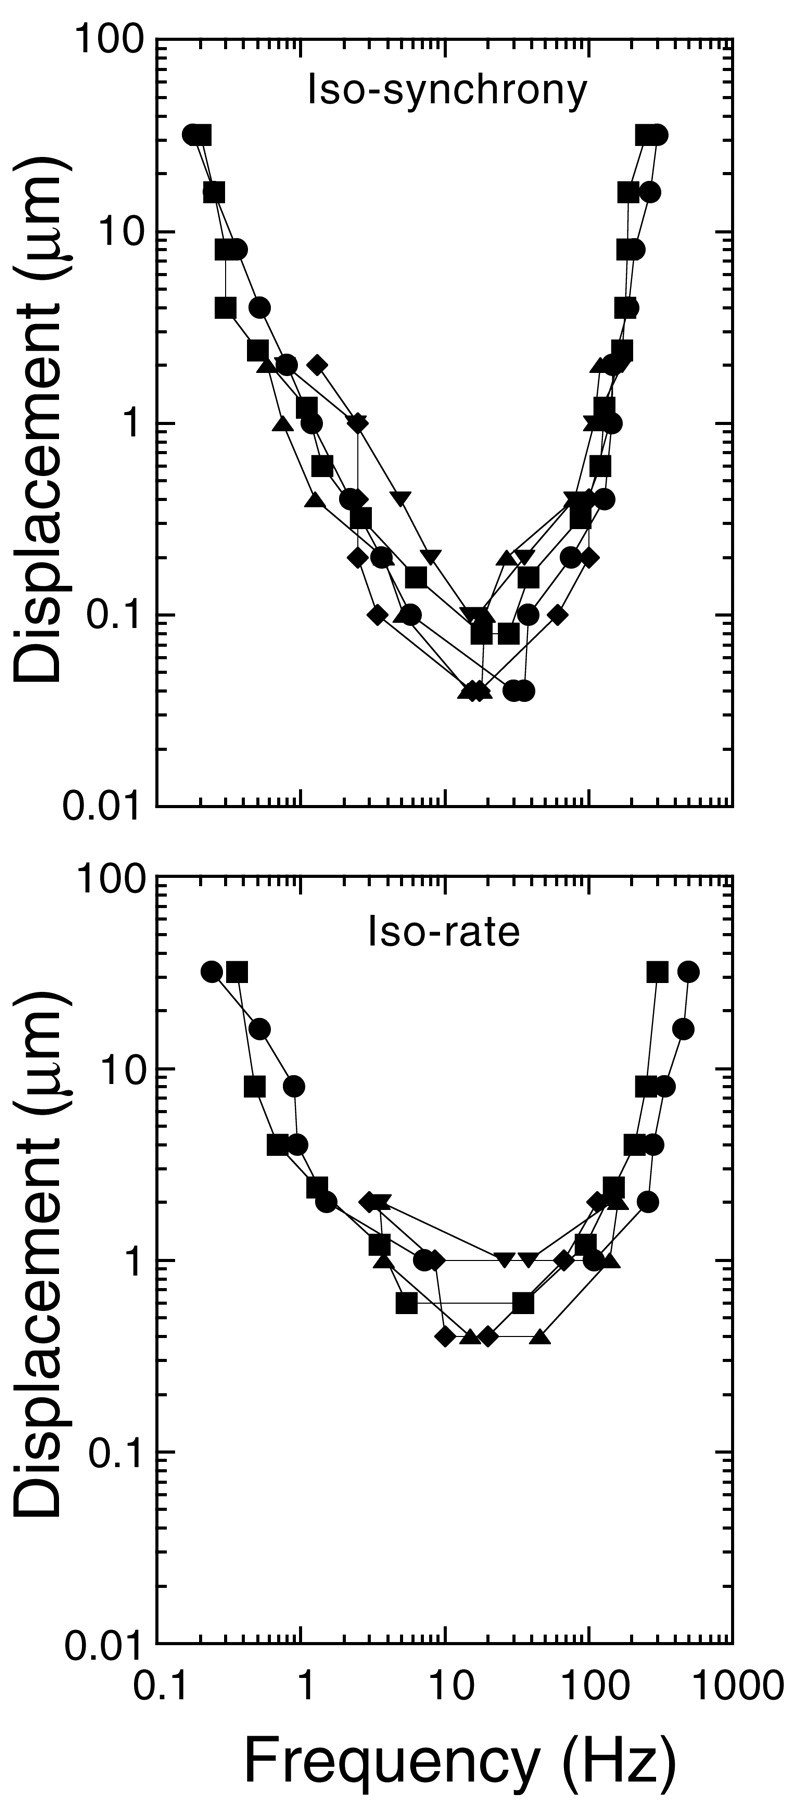
Fig. 3.

Threshold tuning curves for five fibers were generated from isodisplacement functions using SI (top) and DR (bottom) criterion levels for threshold. Threshold criteria for SI were displacements producing an SI of 0.15. Threshold criteria for DR were displacements producing a DR of 1.25. High (above 128 Hz) and low (below 1 Hz) frequency tails of the tuning curves are extrapolated from the isodisplacement functions by interpolation of the last two data points.
